EOSBTC trade ideas


EOS IS READY FOR LIFTOFFEOS looks stupid bullish. We broke out of a huge accumulation phase, retested a few days ago now we just need to break the blue weekly level. After the blue levels are broken we could go to the moon.


EOS Buy TargetLooking to buy some EOS when it hits a new low around 1500 satoshi. Assuming this would happen before middle of the year.
EOS Supports/Resistances. Breakout of 22 week consolidation.EOS Supports/Resistances. Breakout of 22 week consolidation.

$EOS - New wave coming ?$EOS is in retest after accumulation
We are looking for a move on the orange line with a SL on the red line (old ascending trendline zone)
Not a financial advice


EOS - Looking good - Best entry for a high probability tradePrice broke strong resistance, and there is a high probability that previous resistance will become our next support before going up.
Also see how the trend is changing to bullish, price is making higher highs and higher lows.
The best entry is to wait for price to come back to 0.0003993 and long from there.
Remember : When resistance is broken, very often it becomes support.

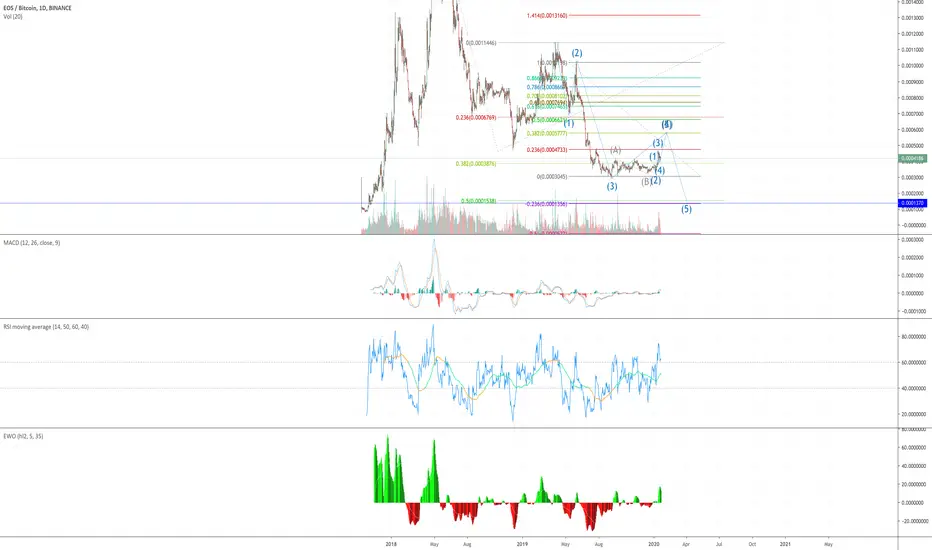
EOS will run 22.4% faster according to analysisEOS will run 22.4% faster according to analysis following Elliott Waves 1-5, Elliott Waves retracement ABC, and Fibonacci retracement.
Next target 78.60%

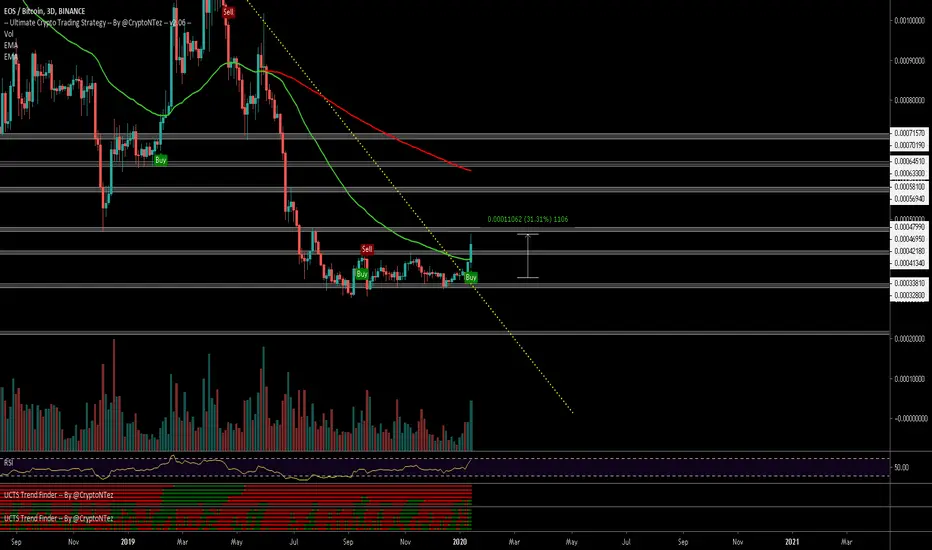
$EOS, 30% up on a 6 days movement$EOS
30% up on a 6 days movement
Crossing over 2y long descending trendline 🧐🧐
Currently pushed againts ~48k sats resistance & retraced
Looking for a prior level retest or R/S Flip as potential entry
UCTS Buy signal flashing on the 3D (1D/2D active)
Volume increasing
#EOS
EOS Bullish potential EOS currently gaining momentum after higher lows in an Ascending Triangle which had a fake breakdown. the bearish RSI since September has made it crucial for EOS to break over our entry point.
EMA50 has been secured since September and EMA200 to be taken soon, trail your profits.

EOSBTC Bull patternHello,
Chart is clear, This is a strong bullish setup. Follow the instructions,
Good Luck

Bots / Algo / Whales & Miners Controlling Market | EOS AnalysisHere we have a different chart... This EOS chart threw me off, it was hard to read at first as it is a completely new chart for me.
You see, these numbers and laters on the screen /"pairs", Altcoins or whatever they are, all basically move in exactly the same way with just a few variations.
We have bots/algorithms controlling different parts of the movements and depending on which bots are affecting which token/altcoin project pair at any given time, that is what will decide how the chart will be drawn.
So depending on the strength of the project, the team or the pull it has, just to pick a few of the factors that affect the chart, the chart will be drawn differently.
I think there are around 5 major algorithms controlling the market and many other individual custom made ones interacting with them, as well as the public.
Now that I think about it... These bots/whales/groups/algo/etc. can be miners as well for all we know... That doesn't really matter... We buy when prices are down, to sell when everything is green and up.
So all the technicalities are just entertainment if you can here like me for work.
We look for the charts with the lowest risks, aiming always first to win above all... Once you get used to the feeling of winning, you can decide if you want to sell at 20%, 30% or more.
The trick is to get used to selling, securing/collecting profits. Because if you don't sell, everything will be gone when the market goes low.
Buy when the prices are low.
Sell when prices are moving up.
EOS Chart Analysis
We have EOS Token (EOSBTC) trading at support levels, consolidating sideways.
This consolidation can lead to another drop or a move up.
Which one will it be?
Signals
MA200 dropping fast with momentum is my signal that EOSBTC has good chances to move up.
Each time we see MA200 (black line) behaving this way, prices tend to pull towards the Moving Average line indicator. Let's see how it goes.
Even with all this information, we still remain open to all scenarios and always have a plan before we trade.
Example
If prices go lower we stop the trade at xxx price.
If prices start to move higher, this is where I sell and collect profits.
Enjoyed the content?
Feel free to hit LIKE to show your support.
This is Alan Masters.
Namaste.

EOS Starts To Gain Momentum, Huge Jump Ahead | 90%+ PossibleThe EOS (EOSBTC) chart is preparing for a massive jump. We have 5 consecutive green candles with low volume to break above EMA10 and EMA50, telling us that the break below EMA10 back on the 17-Dec. was a fake breakdown.
With a strong RSI and flat MACD, this setup is perfect for a strong impulse move... Some barriers need to be taken out first.
The black trendlines clearly depict how EOSBTC has been moving. Consolidation can happen within this range and any break above or below will lead to a strong move.
My view
EOS Is preparing to grow big time.
Take a look at this chart EOSH20:
Feel free to leave a comment if you have something to share with us.
Thanks a lot for reading.
Namaste.

EOS/BTC ascending triangle confirmationAscending triangle confirmation on close at .00042
Target .00053
Trend breakout of a 165 day range as well.

EOSBTC, EOS - Bitcoin: Rectangle ready to breakoutBINANCE:EOSBTC
On EOSBTC we notice a clear rectangle in which the price has been in this range for 5 months now.
We think the EOS blockchain is interesting, thanks to its DPoS protocol, even if between the two considered cryptocurrencies we remain more and more Long on BTC, because it has a history, better fundamental criteria and a greater interest from the mainstream, and we also consider it extremely decentralized.
In this case, if we had EOS in our portfolio, we believe that with an upward breakout we would reduce the allocation on BTC in exchange for EOS viceversa with a downward breakout.
Good trading, everybody!

EOS grand reversalFirst of all take a look at week timeframe chart. It is very promising.
But what it tells as well is that it is just consolidation channel, so price may swing up and down for some more time. Given buy/long zones are for bullish scenario, where price don't move to the bottom of consolidation channel and slowly start to grow from here.
Targets for breakout are 4380 - 4900 - 5200

EOS/BTC seems to be breaking out the 2year resistanceEOSBTC looks pretty bullish last days. Having bigger impulse on the pumps . More likely going to breakout the 2year bearish resistance trendline . RSI already broke up the downtrend . Also i like the bullish structure on 1D where we see a breakout out of cumulative triangle . Volume is not so good but i highly recommend to spectate fundamentals around EOS in next days .
1D chart :

EOSBTCWeekly Bollinger bands super tight, I'm expecting a large move to the upside. Very close to breaking 200MA on the Daily EOSBTC chart too


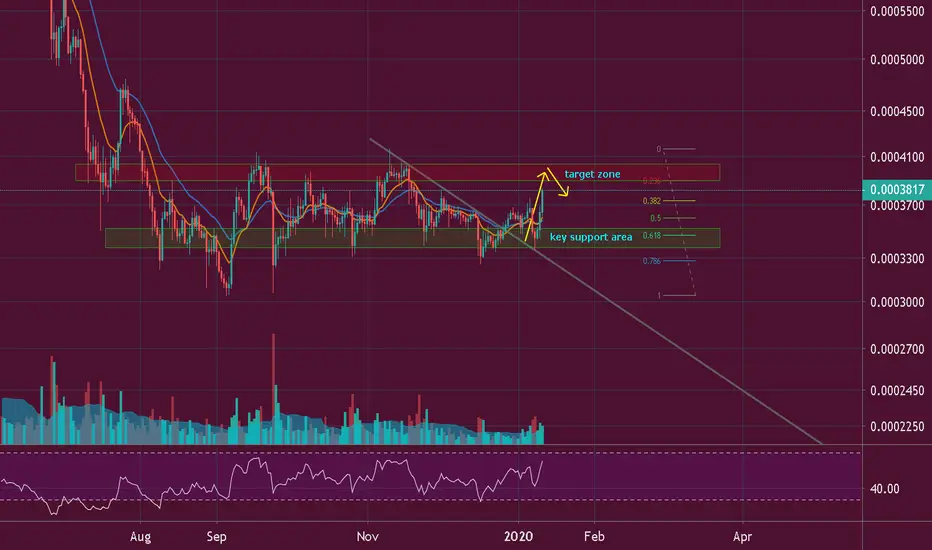
EOS/BTC TA Update (Quick Pump?)EOS/BTC
EOS bounces off at a key support area where the 0.618 Fib is located. EOS also manages to take down the 3756 sats High,
I can see less resistance after it. My next target is around 3900 sats before a potential pullback to happen.