EOSBTC trade ideas

EOSBTC, Sell on H4.EOSBTC, Sell on H4.
H4:
- Tendency: Downward
- Break and below trendline
- Pullback: Test trendline
=> Sell

EOSBTC, Sell on H4.EOSBTC, Sell on H4.
H4:
- Tendency: Downward
- Break and below trendline
- Pullback: Test trendline
=> Sell

EOSBTC At An Imporant TrendlineEOSBTC broke out of the triangle some days ago. We get a wick up just some sats above prev. resistance and took many stop losses (yellow circle).
After that start testing the trendline and got a daily close under the trendline. But we reclaimed it and it looks like we are closing above it which leads to a very bullish signal here.
Also we are forming higher lows for the past weeks.


EOS/BTC Looks Bullish in Daily TFBullish Characteristics:
Ichimoku Cloud -
- Beginning of a cloud twist appears to be forming ahead (From RED to GREEN)
- Tenkan-Sen/Conversion line crossed above Kijun-Sen/Base line (Blue line above Red line) or (Fast MA above Slow MA)
- Price broke through Senkou/Leading Span B into the red cloud, has since retested Span B (GREEN cloud line) as support and will look to cross the cloud for a breakout above Senkou/Leading Span A (RED cloud line).
- Chikou/Lagging Span. Should break above price action and/or cloud once the breakout occurs giving further bullish confirmation.
Ascending Triangle -
- Price near end of bullish pattern
- Volume slowly declining (Less trades as traders wait to see where price goes upon pattern completion
RSI -
- Respected a clear resistance line until it broke through (simultaneously while price broke into cloud).
- Line was retested for a support and held up
- Outlined in RED is a hidden bullish divergence
- Also looks as if RSI will be able to stay above 50 indicating a possible trend reversal.
Entry -
- I believe since price is bouncing off support along the ascending triangle as well as the Span B line within the cloud, taking a long at the current price would be safe. A more conservative approach would be to wait until price breaks out above the cloud along with the Tenkan line over the Kijun Line. And waiting for Lagging span to break above price as well.
Exit -
- Targets could include measured move of Triangle
- Could also wait for a cross of Tenkan (Blue) below Kijun (Red) after breakout
- Or set TP at next resistance after Breakout
- Set Stop loss below 3000 sats for first entry, or below most recent swing low for more conservative entry
This is not financial advice. For personal reference and discussion only. GL!!!

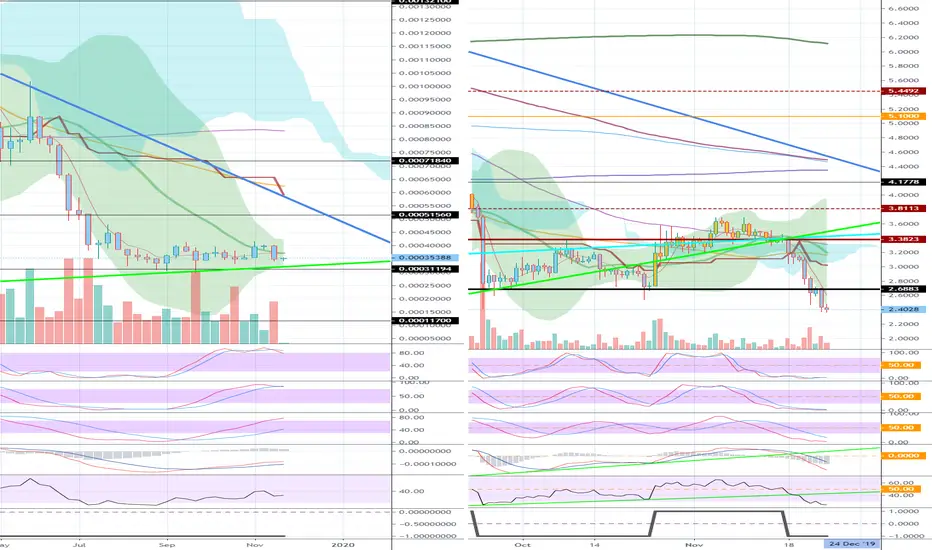
Eos
If the price is supported by the 0.00031194 point and the uptrend line, and the price is maintained, and the break out of the fast downtrend line, I think a lot of upside is possible.
Below 2.6883 is the mid- to long-term investment area.
If you buy slowly when you see a rise at this point, you can see good results next year.
The 1.55 point is the point that can be reached after a lot of decline to the next support point.
I have to be careful about buying.
The extent of the uptrend will be determined by the uptrend line and how it moves above 3.3823.
EOS BTC LongPrice is reacting from a very strong level of Weekly demand and is in control, no shorts allowed until demand is taken out.

Easy 10% with $EOS Ride to the top of the ascending triangle. MACD is turning. RSI rising.
Tight stoploss at 3540
Take this idea with a grain of salt as you should with all trading.

EOSBTC Weekly Heikin AshiFollowing the weekly Heikin Ashi on EOSBTC from ICO to now goes 20x with a 30% drawdown. The last 3 months have been shaky, so this trend might have played itself out, but it might still hold some power.


Heikin Ashi 2-day trend followLong on a green 2-day Heikin Ashi green candle. Short on a 2-day Heikin Ashi red candle. All trades with 100% of equity. This strategy is always in a short or long position
Aside from a bad performance at the end of 2018, this strategy performs very well. It's been doing great in 2019.

Simplified Turtle StrategyTake a position on a 55-day breakout, close the position on a 20-day breakout in the opposite direction.
8x since EOS's launch

EOSBTC LONGLet's try this one more time. Dom drop inbound in my opinion. I can post a video justification for it but it won't be till later.
God speed gents,
Mr. Manbearpig


EOSBTC - looking quite goodLooking for a break above the 0.786 fib level to enter the trade. Possible target is the golden ratio with an possible 20%. tight stop loss :)


Elliot Wave formation LONG EOSBTC signals another wave pendingPlease review charting for figures: provided a short/mid/long target for you folks and most importantly: a stop-loss IMHO EOS has been VASTLY undersold; henceforth, I would apply a forexsignal to EOSUSD and even EOSETH another undersold token which is capable of scaling and will do so IMHO.
Disclaimer
Not financial advise.
-@a1mtarabichi

First stop?Found resistance at indicated level, not enough volume to go up the ascending channel. Lower highs on rsi stand for an immediate decrease in price. Fear growing, trade alts carefully as btc dominance is about to move. Short term trade within indicated levels. Trade safe.

EOS/BTC potentially finished BEAR MARKET? LONG TERMIt seems like Highcaps/BTC found their bear run bottoms and after few months consolidation moving dangerously close to resistance trendline from the start of THE BIG CORRECTION! As we know from history EOS like to pre-start big moves for market and it may be also this time , when EOS begin new trend by huge parabolic PUMP .
Here is the 1D chart , where you can see the interest of EOS moving inconspicuously UP. :
On the 3D chart we see a great falling wedge pattern known as the BULLISH pattern in downtrend and continuation pattern in BULL TREND by 70% . Can not really imagine a new bottom after that big accumulation on the bottom around Point of Control (3600sat)
Follow me for more charts weekly !
