EOSBTC LONG Looks like its gaining strength. Not actually taking this trade but it does look a little pumpy.
God Speed,
Mr. Manbearpig
EOSBTC trade ideas

EW Count So got a trade setup here with targets shown and failure points...the blue box is the peak for our wave 3 and I have 2 scenarios for counts to play out let's see what happens gl.


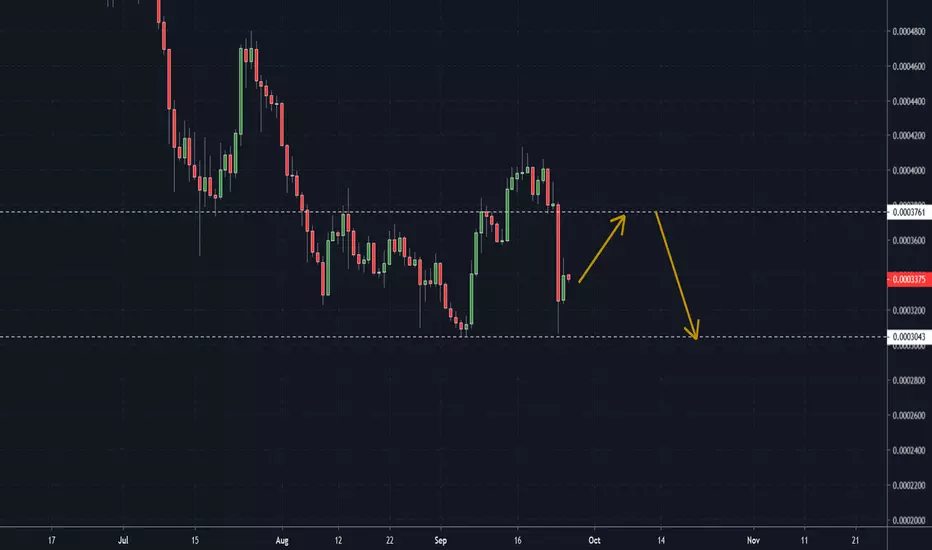
EOS, the Bulls fight for every single bar After a strong bearish imbalance and a 19% price drop, the price recovered.
The volume was pretty weak though, what shows us, that it could just be a simple pullback, before the price continues to drop.
The rising candles had long shadows, a sign of bullish uncertainty.
The major resistance line at 3809 hasn´t been reached.
One support is the 30 EMA, if the price drops below it, a next support level is the rising support line.
If this level gets broken, the price can drop till 3043.
If you found this post helpful, like, comment, and subscribe!
Telegram Signals
t.me

#EOS - Formed a Net, Let's Observe! On a daily chart EOS price has formed a converged 2-ways net. The first call will occur in the first orange zone where priorities will be distributed. Now the priority is upward , as the price has moved out of the lower quarters to a higher level.
If the price remains in the bullish zone without entering the bearish quarters, then the next movement will be upward . However, if the price moves to the bearish quarters and remains there, then we will see a dump soon.
Dotted line - bearish option
Solid line - bullish option

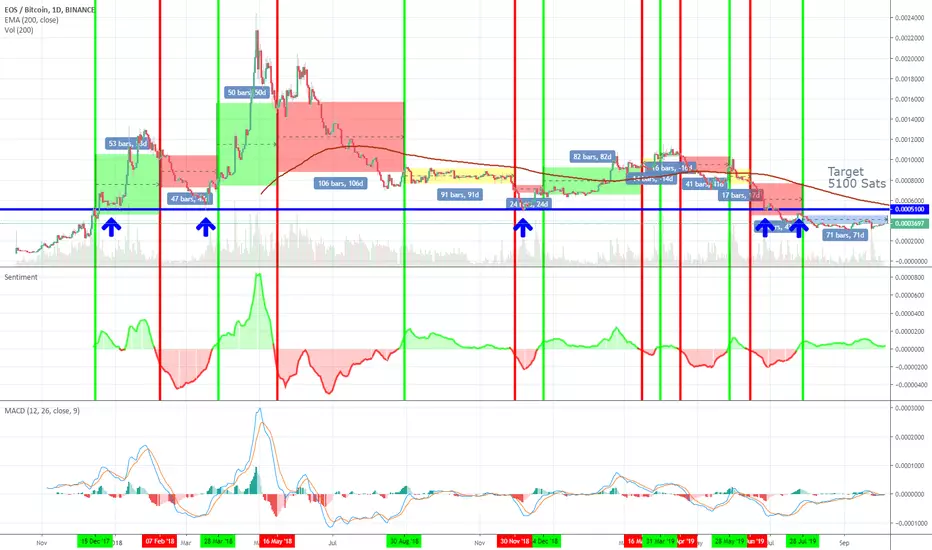
Target 5100 SatsThe sentiment indicator has proven to be a fairly reliable indicator for EOS/BTC. By marking points in time shortly after the indicator changed color, the green date ranges indicating correct buy signals, red showing correct sell signals, yellow indicating a bad call, and blue indicating what we don't know yet. It has definitely been right more than wrong. This is currently indicating a buy signal.
The 5100 Sat level has shown to be a very strong resistance and support level. It appears we will hit this at approximately the same time we contact the 200 EMA and will likely have at least one rejection before breaking through, if we do. 5100 Sats would make for a 37% gain.
I am not a professional. This is for educational purposes only and is not advise to buy or sell.

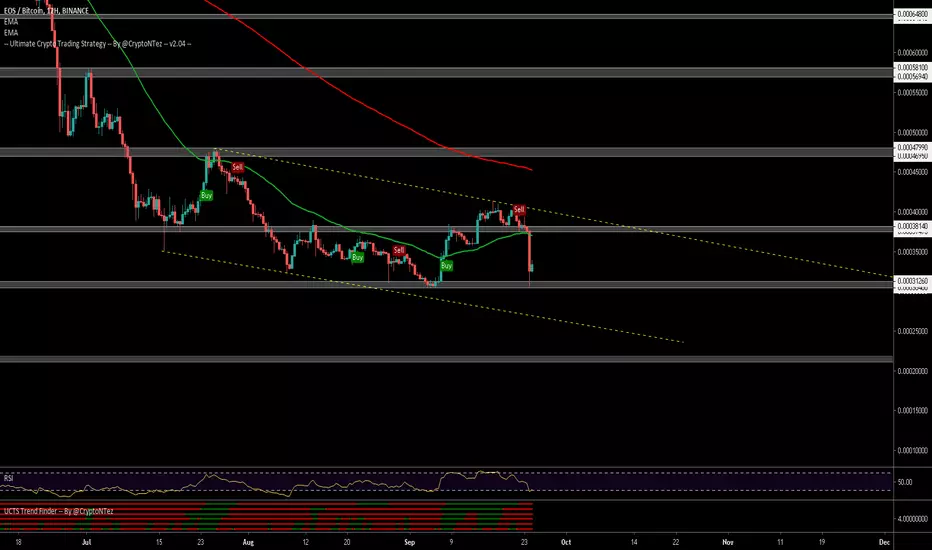
EOSBTC - 4H LONG IDEAEOS/BTC is looking bullish on the 4H Timeframe, along with other major altcoins. EOS/BTC is trading inside an Ascending Triangle on 4H Timeframe - which is bullish in nature. Breakout is most Likely.
Trade Signal:
Direction: LONG
Entries- 0.000034-36 BTC
Exit- 0.00004-42 BTC
STOP: 0.000032 BTC
Timeframe: 2-5 Days

SHORT EOSBTCIve never seen a more obvious short than this. I mean nothing is 100% but it is certainly within my risk parameters. I have been short shince yesterdays second spike so I am grateful I got in 3% higher thus decreasing the already low risk but this is great as well. I just got my confirmation.
God Speed,
Mr. Manbearpig

EOS in a bullish trend EOS has found its self following this bullish channel, as well as the ichimoku cloud looking bullish on the 4H

Good enterHead and shoulders are completed and now go up to 110000sat and 240000sat
I bought all my balance

EOS oversold ?EOS after huge crash. Possible rebound to EMA 50 level. EOS RSI oversold level. MACD bullish crossover but still bellow zero line, need more confirmations. EOS hold above new trend line. Candlestick pattern drawing 3inside up pattern.
Disclaimer: THIS IS NOT FINANCIAL ADVICE. All the information shared here is for learning and entertainment purposes only.

$EOS, In a descending channel..$EOS
In a descending channel, Sitting at Lowest value of 2018 & 2019..
Found some buying volume as soon as it touched this level but at least for now not looking very good
RSI at oversold levels (bearish)
Failing to hodl current level should lead to ~20k sats (30% drop)
#EOS
EOSBTC aiming for Double BottomHello Dear Friends,
I believe EOS will either go through a temporary correction or just continue its downtrend.
The key points in favor of this scenario are:
1. Head and Shoulders at the top.
2. Huge selling red volume bar at the top.
3. Bearish divergence in the MACD and RSI.
4. BTC is the king.
Key points against are:
1. If BTC decides to correct it could favor EOS temporarily.
2. Ethereum is highly correlated with EOS, so if ETH continues climbing its very likely EOS will climb too.
If you like this analysis, a like would be greatly appreciated. Thanks for reading.
Robertus

EOS/BTC, two scenariosIn the past days, I wasn't able to trade and i missed the whole movements of altcoins... Today i started to analyze again and i saw these monster bullish divergences we had on eos/btc and in a lot of altcoins. So what to do now if you miss this train?
As always i show two possible scenarios with some levels to respect.
- Bullish scenario
Eos is going on a very hot zone. Today touched level 0.618 of fibonacci and got stopped. I think that if Eos will break the dashed line and the yellow circle (4300-4400 area), could rise to the blue rectangle, 4800-5000 area. The yellow circle is an hard area to break... here we have level 0.705 of Fibonacci, the bottom of Ichimoku cloud, and the MA 100 (blue line). So probably from this area, eos will have a pullback, but once that the area has been broken, i think will reach 4800 with no difficulty.
- Bearish scenario
Mfi and other indicartors look like have topped. On lower timeframes, there are some bearish divergences, so could be the time for a retracement!
On my mind the short signal will be given by a fakeout of the black dashed line. I think could reach 4200-4300, then dump.
Targets for the short are on the chart

EOSIn Weekly chart we formed falling wedge and we still inside this pattern, so first we need reach resistance line at price around 0.0004800
In daily chart we can see down trend channel. We touched support line of channel and moving to midle line at 0.0004500 area also at this price we can see MA100
In small time frames we can see how we going in uptrend channel and now we below midle line of this channel. We can test again support line and go to resistance line of this channel

eos chart analysiswell after upgrade it is dumping, it could be sell the news, but it happened much earlier than i expected.
Maybe market have learned sell the news enough so people are selling it much before now.
anyway eos lost daily uptrend not it seems bad, just want to know if there is any good news.
wait till it actually pump with volume and get in.
btc seems like it might fall below triagle so keep that in mind

EOSBTC- Price reversal?More sign of breaking through the down-sloping resistance are in place.
On the 4hours time frame, the price chart of EOSBTC has been spotted forming a descending channel with the respect of the lower-highs and lower-lows. The shape looks like a pipe tilted up or down, but not horizontal, the two trendlines should be parallel or nearly so. Both should tilt upward or both should tilt downward.
Breakout Occurs when price closes outside the trendline boundary and can be in any direction.
If price closes outside the channel in the adverse direction, then close out the trade and consider trading in the direction of the new trend.
Here it is more likely the price break through the resistance. Always wait for the breakout from the resistance.
Breakout level: 0.0003979sats
Resistance 1: 0.0004014sats
Resistance 2: 0.0004064sats
Resistance 3: 0.0004134sats
Resistance 4: 0.0004205sats
Resistance 5:0.0004307sats
Good luck to everyone! Click the follow button to stay tuned for more trading ideas! Like the idea? Hit the like button!
Ideas published should not be referred to as an investment advice.

Possible inverted head and shoulders forming on EOSI put it on the line chart so to lose all the noise and then found this potential Inverted H&S. Lets see if it plays out and moves higher.

EOS/BTC Gartley Bullish PatternBullish Harmonic pattern on EOS/BTC. Looking to take profit 50% at Target 1, 50% Target 2.

EOS - Tried and Failed On Target AreaSomewhat a nightmare when you consider that EOS was on a good run and then the BTC dominance started to tail off meaning a slow down in momentum.
Personally we suggest waiting for entry. Keep a close eye on what dominance is doing. Alts will pump once more.

LONG EOSBTCLooks like you can get a good 8% on this trade long with a 2-3% stop loss and 3% risk. The market has been absolutely wonderful with some great volatility lately.
God Speed Gents,
Mr. Manbearpig
