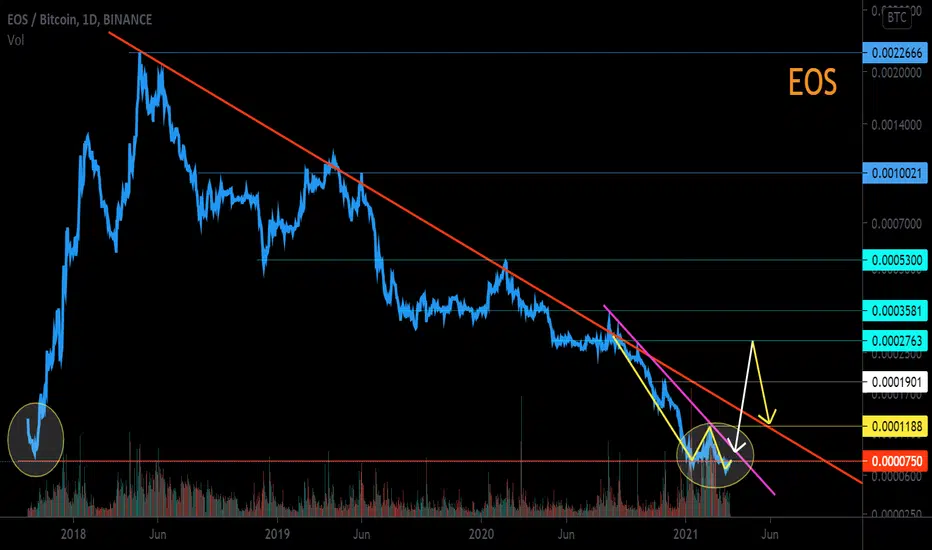
EOS / BTC Line chart. The main trend. Potential trend reversalI specially show the main trend of this trading pair on a line chart in order to remove the "market noise". Perhaps we are witnessing the emergence of a new uptrend. At the moment, the price is in the zone of historical lows.
Locally, in the secondary trend, the price leveling occurs, thereby forming the "Dragon" pattern. Two "paws" have formed. It will only be confirmed when the price breaks the downtrend of the secondary trend (purple). The reversal of the main downtrend itself will occur only when the price can overcome the red line shown on the chart.
The situation on this trading pair is similar to both ATOM/BTC before the reversal (at the moment about + 300% from the entry point).
The section of the graph of this trading situation in the secondary trend where the "Dragon" pattern is formed.
EOS / BTC Secondary Trend Potential Dragon and Pivot Zone
EOSBTC trade ideas
EOS BTC back at the previous area of interestThis is a follow up to my previous EOS BTC trade.
We're back at the level that provided support last times (2017, early 2021).
Will it provide support again ? I have no idea. Would love a reclaim of the 8100 level as a first confirmation.
I'm willing to start putting a bit of risk here and add on the way up if the area provides a bounce.
This is a weekly time frame trade, very relaxed and low pressure, putting that sleeping BTC to work.
Good day to all my fellow tradingview friends & readers.

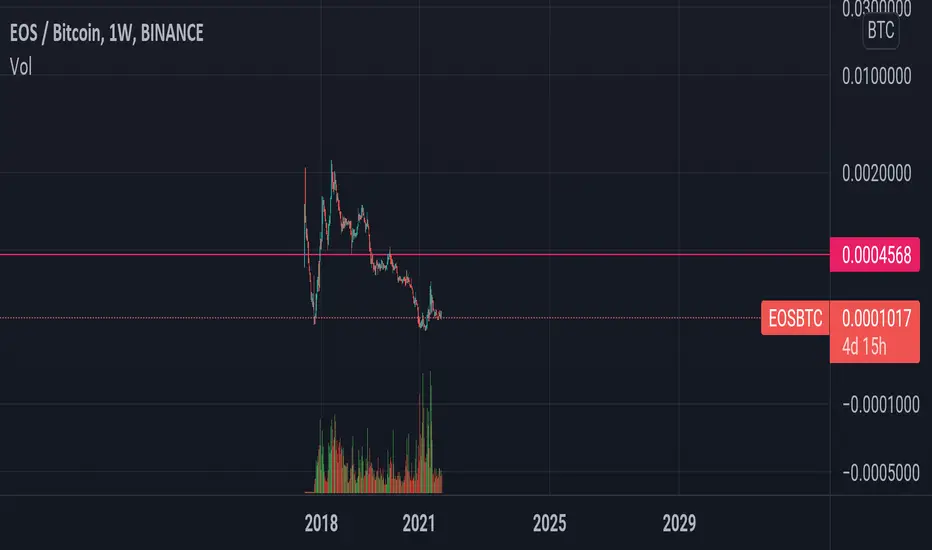
EOS/BTC 2021-2022This chart is even more convincing (than EOS/ETH) for the future rise of EOS, the bottom boundary seems to hold and reversal seems imminent.

EOS / BTCEveryone who really dislikes EOS, just understand that this is a hybrid of ETH + XRP and your attitude towards it will change. Look at the capitalization of XRP, it is technologically inferior to EOS.

EOSBTC is testing the daily resistance 🦐EOSBTC is testing the daily resistance 🦐
IF the price is going to have a breakout, According to Plancton's strategy (check our Academy ), we can set a nice order
–––––
Follow the Shrimp 🦐
Keep in mind.
🟣 Purple structure -> Monthly structure.
🔴 Red structure -> Weekly structure.
🔵 Blue structure -> Daily structure.
🟡 Yellow structure -> 4h structure.
⚫️ Black structure -> <4h structure.

EOSBTC Technical Analysis
⏳ Spot
💎 EOSBTC has formed a Wedge pattern. The large green candle indicates that there is a strong possibility that the price breaks above the Wedge and after the retest we see bullish run.
🏁 Short & Medium Term
💵 Invest Only 5% of your Portfolio
🎳 Entry at market or 0.0000825
☕️ TP1 0.0001200
🍺 TP2 0.0001800
🍻 TP3 0.0002500
🍾 TP4 __________
🍷 TP5 __________
🍸 TP6 __________
🍹 TP7 __________
🎁 TP8 __________
🚫 SL 0.0000700
Good Luck 🎲
Check the Links in Description and If you LIKE this analysis, Please support our page and Ideas by hitting the LIKE 👍 button. ❤️ Your Support is really appreciated! ❤️
Traders, if you have your own opinion about it, please write your own in the comment box. We will be glad for this.
Feel free to request any pair/instrument analysis or ask any questions in the comment section below.
We will have more FREE forecasts in TradingView soon
Have a Profitable Day

✅EOS💥+700% (Almost Perfect Spot to Buy)✅EOS is Ready to start Alt Season. (Possible begining in November, like it happen in 2017).
✅Ready to make 8x.
✅Above Trend Line & after Break Out
✅Near Strong Support
✅It will be hard to get better price like the one in my previous post 1D about EOS called the Perfect to Buy (I will leave the link below)

Hope you are ready for EOSBTC moonCandle pattern taken from the BTC 2017-2018 years when people thought BTC was dying - People were scared to buy 1BTC for 3K$
Now it's 2021 - We look at the chart EOSBTC. It spent a lot of time in Downtrend and now in accumulation.
Most of the people think EOS is dead (actually not at all), and it's ready for a good ride. Are you?
Main goal is mentioned.
Not a financial advice, just similarities. Good luck.

EOS 10% Rise As Investors Gain ConfidenceEOS Climbs 10% As Investors Gain Confidence
EOS was exchanging at $4.3188 by 17:10 (21:10 GMT) on the Investing.com Index on Wednesday, up 10.30% on the day. It was the biggest one-day rate acquire since September 22.
The move upwards pushed EOS's market cap up to $4.0947B, or 0.21% of the absolute cryptographic money market cap. At its most noteworthy, EOS's market cap was $17.5290B.
EOS had exchanged a scope of $3.8084 to $4.3205 in the past 24 hours.
In the course of recent days, EOS has seen a drop in esteem, as it lost 16%. The volume of EOS exchanged the 24 hours to season of composing was $1.4611B or 1.14% of the absolute volume of all cryptographic forms of money. It has exchanged a scope of $3.7936 to $5.5087 in the beyond 7 days.
At its present value, EOS is as yet down 81.21% from its unsurpassed high of $22.98 set on April 29, 2018.
Somewhere else in digital currency exchanging
Bitcoin was keep going at $43,570.4 on the Investing.com Index, up 6.45% on the day.
Ethereum was exchanging at $3,035.62 on the Investing.com Index, an increase of 9.73%.
Bitcoin's market cap was last at $819.6668B or 42.08% of the all out cryptographic money market cap, while Ethereum's market cap added up to $357.0760B or 18.33% of the complete digital currency market esteem.

Eos is waking up ?
Eos will rise again like Phoenix ? Or it is realy game over on EOS/BTC CHART
ONE LAST CHANCE

EOS/BTC buy opportunityHi followers,
EOSBTC showing first signs of trend reversal, after long period of consolidation, the pair forming slightly higher highs.
A break out above the resistance line can be very powerful move.
Don't forget to manage your risk! 👌
Good luck and trade with care 🙏
If you like my content - 👍 Like, 💬 comment, 👆 follow and 👉 share!
❗❗❗
Disclaimer: This information is not a recommendation to BUY or SELL. It is to be used for educational purposes only!

EOS/BTC Long (Long-term and Safe)If you want more BTC in the future, it's a good opportunity for you.
We are in the lowest level of the weekly support.
You can see the resistance levels on the chart.
You can enter in the current price and set different take profits step by step in each level.
It's takes time to reach the top levels but it could be happen.
* This is not a financial advice

EOSBTCEOS has formed a diametric pattern and we are in the end wave G and the next months can be good for this coin.

Mathematical brotherhoodMight go to 4500 satoshi then get rejected then go high like 500 $ :)
@ClearOpenDoor what do you see?
Also tp generators based on ta are not accurate, in my point of view, cycles of ath are more accurate, as you know total is buggy out of eth (if we believe btc is king)
🕊️
Disclaimer: all the settings (if & else) here i talk about are designed for my own perception of life and crypto
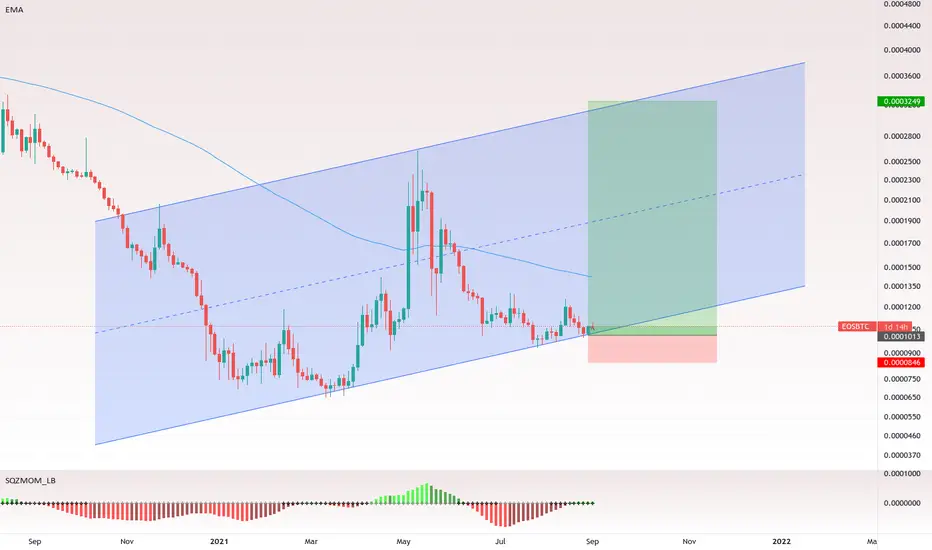
Quite a setup here on eos-btc ratioLooking at squeeze momentum indicator, it is clear that market is prepared for a big move.
Then you look at the chart and you spot this wide channel where all the action is happening for over a year now.
Price is now at the bottom of the channel.
What is interesting is that top of this channel is very near weekly EMA(100). So, overall it's a very good target to aim at.
Judging by the former such move, where price moved from bottom to top of the channel in mere 45 days. If this move is to happen again, peak pump should be in late October.
tp1: 1650 sat
tp2: 2040 sat
tp3: 3200 sat

EOSBTC is testing the weekly support 🦐EOSBTC is testing the weekly support. If the price is going to recover the daily support, we can add and wait for apply our rules for a long position, otherwise, if the price is going to lose the weekly support, we can add in our watchlist and wait for apply short position.
At the moment the price isn't in a trade zone for our rules, we need to wait for a trigger

EOSBTC Technical Analysis
⏳ Spot
💎 EOSBTC on H4 has formed a Descending channel and a triangle. I expect the price go lower to the Pullback zone in the channel before it goes higher.
🏁 Short & Medium Term
💵 Invest Only 5% of your Portfolio
🎳 Entry at market or 0.0000860
☕️ TP1 0.0001060
🍺 TP2 0.0001100
🍻 TP3 0.0001140
🍾 TP4 0.0001200
🍷 TP5 0.0001250
🍸 TP6 0.0001299
🍹 TP7 0.0001390
🎁 TP8 0.0001865
🚫 SL 0.0000645
Good Luck 🎲
Check the Links in Description and If you LIKE this analysis, Please support our page and Ideas by hitting the LIKE 👍 button. ❤️ Your Support is really appreciated! ❤️
Traders, if you have your own opinion about it, please write your own in the comment box. We will be glad for this.
Feel free to request any pair/instrument analysis or ask any questions in the comment section below.
We will have more FREE forecasts in TradingView soon
Have a Profitable Day

#Eos / #Btc #Spot #Midterm
Entry Zone :0.00010130 / 0.00009502
Target :
01 : 0.000124
02 : 0.000139
03 : 0.000155
04 : 0.000175
05 :0.000214
Buy 02 : 0.00008230
Buy 03 : 0.00006760
Don't risk more then 3% of capital.

EOSBTC ready to takeoffif you see my profile, you'd see both EOSUSDT and EOSBTC charts are indicating an upcoming wave for this coin. do not miss out.

EOS - The Moon Cryptocurrency BreakoutRecently I was alerted to a potential break out by a fellow trader - After analysing his chart and then doing my own analysis - Thanks to this fellow trader I have discovered the next level for EOS
PREPARE FOR THE GREATEST BREAKOUT YOU'VE SEEN SINCE ALT SEASON HIT.
EOS Price $3.06
Price Change
24h $-0.03474 1.14%
24h Low / 24h High
$2.99 /$3.13
Trading Volume
24h $2,957,305,850.38 12.82%
Market Dominance 0.26%
Market Rank #18
EOS Market Cap
Market Cap $2,907,186,682.87 1.13%
EOS Price Yesterday
Yesterday's Low / High
$2.99 /
$3.12
Yesterday's Open / Close
$3.00 /
$3.06
Yesterday's Change
2.08%
Yesterday's Volume $2,585,205,674.78
EOS Price History
7d Low / 7d High
$2.66 /
$3.26
30d Low / 30d High
$2.41 /
$3.92
90d Low / 90d High
$2.03 /
$3.92
52 Week Low / 52 Week High
$1.46 /
$5.48
All Time High
Apr 29, 2018 (3 years ago)
$22.89
86.63%
All Time Low
Oct 23, 2017 (3 years ago)
$0.4802
537.1%
EOS ROI
196.64%
BINANCE:EOSUSDT
BINANCE:EOSBTC
BITFINEX:EOSUSD
KRAKEN:EOSUSD
KRAKEN:EOSEUR
FTX:EOSPERP
HUOBI:EOSUSDT
BINANCE:EOSBUSD
BITFINEX:EOSBTC
BINANCE:EOSUSDTPERP
COINBASE:EOSUSD
BINANCE:EOSUSD
KUCOIN:EOSUSDT
BINANCE:EOSETH
OKEX:EOSUSDT
BINANCE:EOSEUR
POLONIEX:EOSUSDT
BITHUMB:EOSKRW
BITFINEX:EOSTRY
CRYPTOCAP:EOS.D
KRAKEN:EOSXBT
BITFINEX:EOSGBP
BINANCE:EOSBNB
POLONIEX:EOSBTC


