Wyckoff Phase E Long trading Idea 75% win target 5$Only for self Education if it is go $ 3 2 1 just keep ur wallet & wait -6 month
EOSBULLUSD trade ideas


EOS:DOWNTREND BEARISH FIBO IDEA|PRICE ACTION|SHORT SETUP 🔔Welcome back Traders, Investors, and Community!
Check the Links on BIO and If you LIKE this analysis, Please support our page by hitting the LIKE 👍 button
Traders, if you like this idea or have your own opinion about it, please write your own in the comment box . We will be glad for this.
Feel free to request any pair/instrument analysis or ask any questions in the comment section below.
Have a Good Day Trading !
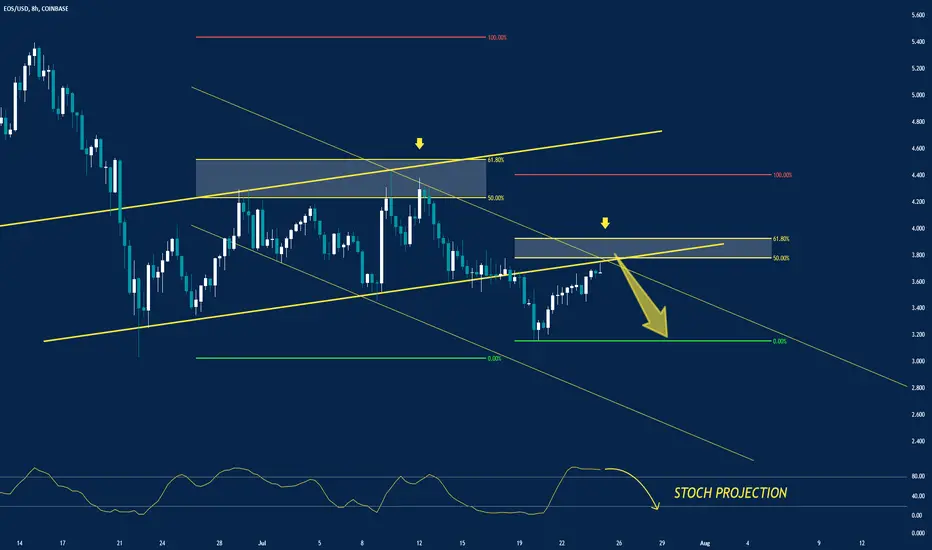

Best price to sell EOS is now EOS is now retesting the broken bear flag. It seems that is moving inside a falling channel to meet the potential target of around 2.6$.


EOSUSD: A Successful Leveraged Position Guide I was waiting for Doge to reach for 1 USD when I heard that Mark Cuban shorted it! Strange! Right?! There are some important points to be noted here, but I would name it "Probabilistic Mathematical Approach to Trading" as follows (even the Psychologicals of Trading):
1. How Mathematically it was Probable for Doge to grow from 0.77 to 1 USD?
2. Mathematically how much more it could manage to grow - I mean in percentages?
3. We are being told about how risky it is to open leveraged positions. Yes! They are too risky and yet highly profitable.
4. Based on the 90,90,90 Principle 90% of trader lose 90% of their wealth during the 1st 90 days! It is meant to be profitable for professionals who know several things:
4.1. Capital/Money Management
4.1.1. Always save 30% of your available money for things that might happen and you have no idea of. You are going to need that money:
4.1.1.1. Firstly, your prediction on the direction in one certain "TIMEFRAME" might turn to be wrong. Then based on that timeframe you may spot some part of that money.
4.1.1.2. When things go wrong you will not go bankrupt.
4.2. Risk Management
4.2.1. You need to "CALCULATE" Risk/Reward Ratio just before any trade based on you Trading Timeframe. It cannot be more less 1/4. This is very important to consider.
4.2.2. Just consider KEY SUPPORT/RESISTNCE Levels/Clusters - Dynamically & Statically (short near a strong Resistance & vice versa)
4.2.3. With a certain amount of money which has already been dividend into say 3 parts you may Long as follows (see the chart):
* For every position calculate the Risk/Reward Ratio;
- Long at the current Market Price with 3 - 5X : price needs to drop 30 - 20% for you to be liquidated. I longed EOS at 3.29 yesterday. (targeted at 20USD)
- Set a Stop-limit long at a lower price which is overlapping at least 5% of your previous position. I longed EOS at 2.6 as well. (targeted the same)
- Propose the Worst Case Scenario now long it with 3 - 5X. How possible is it to happen? I longed EOS at even 1.34!!! (targeted the same)
This is "Technical trading Mathematics" I am talking about.
4.3. Psychologicals of trading
4.3.1. Psychology of Trading is a SCIENCE. You do need to study about it. Observe the behavior of your specific property.
4.3.2. The market is being Manipulated and has been so ever. There are people whose profit lays in your loss. But, exactly, how powerful are they to impact a specific property?! But the most average & common that has higher turnovers during certain periods of time. Market Cap/Turnover during a certain time interval.
4.3.3. When you are assured that Bitcoin is the most frequently traded one, for example, then you need to know exactly based on the timeframe you have chosen, how much it can be fluctuated?! For instance, in 4H timeframe basis. You need to know the extents of your chosen time frame.
How probable is it to lose all the money?
How probable is it to earn enough to not only compensate probable losses, but also earn much more?
5. Last and not the least, is Reverse Trading Strategy. Earn from long and then earn from shorts when it is the time to do so based on your Tradin Timeframe.
I do believe this way there would be no loss if you know the followings in summary:
1. Mathematically Trading
1.1. Money Management
1.2. Risk Management
1.3. Psychologicals of Trading
1.4. Technicals (the choice of trading time frame; the Elliots; Key Dynamic/Static Support/Resistance Clusters; Volume; Trendlines & Price Movement Channels)
Now, a question comes to mind: If my scenario is going to work for EOS how much loss and/or profit I will have? Provided that out of my calculations applied in sample trading positions mentioned above I win/lose one or two?!
Always remember that you need a predefined Investment/Trading Portfolio Management Plan which requires the followings (PMI PMBOK):
1. Knowledge Areas
2. Processes
3. Tools & Techniques
Some positions are meant to be considered "diamond handed" like a routine business operation, yet some others need to be like BPR Projects and they need to be timely & agile.
(This is a tricky business cause it has its roots in human greed & fear.)

EOSUSD SHORTS ON H1 H1
~Market is in downtrend for sure if eosusd cannot manage to hold above the H1 supply zone(which it broke below), its poised for a further drop to our target.
~Structure is mostly bearish and tending downwards, I expect it to reject the 3.5200 level

✅EOS - exactly what I said now 2 months✅ EOS - exactly what I said now 2 months
EOS continues on his way


EOS incoming pumpLooks like EOS wants to get above that trendline. If we come up and break above it, I think that we should get to the .618 FIB level. Target is higher but I circled some possible resistance at that level.

Long EOS Falling Wedge with perfect retestGot many wicks on the retest showing a lot of support. Should have a move up soon. Not sure about the target because there are different ways to draw in the wedge. But it's roughly somewhere up there.

Eos (EOS) - July 16Hello?
Welcome, traders.
By "following", you can always get new information quickly.
Please also click "Like".
Have a good day.
-------------------------------------
(EOSUSD 1W Chart)
If the price continues to rise in the 1.55-5.1 section, the bottom box section, it is expected to create a new wave.
(1D chart)
If the 4.9655-6.0279 area finds support, it is expected to turn into an uptrend.
It fell from the 4.9655 point and is considered to be entering the mid- to long-term investment area.
In order to break out of the mid- to long-term investment area, the price must rise above the 4.0849 point to maintain the price.
-------------------------------------
(EOSBTC 1W chart)
We'll have to wait and see if we can climb from the bottom box section of 0.0000856-0.0003040.
In particular, we need to see if we can move above the 0.0001470 point and turn into an uptrend.
(1D chart)
If the price is maintained in the 0.0001113-0.0001343 range, it is expected to turn into an uptrend.
In order to continue the uptrend, you need to break out of the downtrend line.
If it falls in the range of 0.0000997-0.0001113, there is a possibility of entering the mid- to long-term investment area, so careful trading is required.
------------------------------------------
We recommend that you trade with your average unit price.
This is because, if the price is below your average unit price, whether it is in an uptrend or in a downtrend, there is a high possibility that you will not be able to get a big profit due to the psychological burden.
The center of all trading starts with the average unit price at which you start trading.
If you ignore this, you may be trading in the wrong direction.
Therefore, it is important to find a way to lower the average unit price and adjust the proportion of the investment, ultimately allowing the funds corresponding to the profits to regenerate themselves.
------------------------------------------------------------ -----------------------------------------------------
** All indicators are lagging indicators.
Therefore, it is important to be aware that the indicator moves accordingly with the movement of price and volume.
However, for the sake of convenience, we are talking in reverse for the interpretation of the indicator.
** The wRSI_SR indicator is an indicator created by adding settings and options to the existing Stochastic RSI indicator.
Therefore, the interpretation is the same as the traditional Stochastic RSI indicator. (K, D line -> R, S line)
** The OBV indicator was re-created by applying a formula to the DepthHouse Trading indicator, an indicator disclosed by oh92. (Thanks for this.)
** See support, resistance, and abbreviation points.
** Support or resistance is based on the closing price of the 1D chart.
** All descriptions are for reference only and do not guarantee a profit or loss in investment.
Explanation of abbreviations displayed in the chart
R: A point or section of resistance that requires a response to preserve profits.
S-L: Stop Loss point or section
S: A point or section where you can buy to make a profit as a support point or section
(Short-term Stop Loss can be said to be a point where profit and loss can be preserved or additional entry can be made through split trading. It is a short-term investment perspective.)
GAP refers to the difference in prices that occurred when the stock market, CME, and BAKKT exchanges were closed because they are not traded 24 hours a day.
G1 : Closing price when closed
G2: Opening price
(Example) Gap (G1-G2)

EOS: Trend Support RetestEOS is retesting trend support after flashing to the 1.272 Fibonacci and retracing. The original swing entry was 3.906. I believe a second leg up is coming. I am using this chart to track its trajectory.
I regularly seek out the most lucrative cryptocurrency swing trades available on all the major exchanges.
My win rates are between 80-85%.
All my charts are clean, straightforward, and easy to follow.
* Not financial advice. Trade at your own risk.

EOS forming a bear flag (2.5 $ target)Forget about what they are telling you, EOS is very bearish on all time frames. While the last alts bull run wasn't enough to resurrect it, EOS is in a danger of getting into a very slow dying trajectory (remains flat for many years until something happens and it goes to 0 with many other useless alts). Bullish exchange wont help EOS, All the money raised from EOS ICO is going to benefit billionaires and block one which is a private company. EOS has failed (adoption went to other competitors) and now its too late, even block one knows this that's why they put all their capital into centralized exchange's business.


Elliott Wave Analysis: EGLD, ADA and EOSTraders, welcome to new video on cryptocurrencies where I cover
EGLD, Cardano (ADA) and EOS.
GH

EOSBTC Breakout and RetestMain point of this post is to show the breakout of the descending channel of EOS on the BTC pair
Price is now testing the top of the channel where the breakout occurred
USD pair is just an idea which identifies major trends and shows the current bull action

EOS - Swing Trade - Long - first target RR 3/1 Back to Back 4 HR Harmonics with double bottom with divergence on the RSI - you also have a 30 MIN pattern showing a tiny head and shoulders with divergence on the 30 MIN RSI...

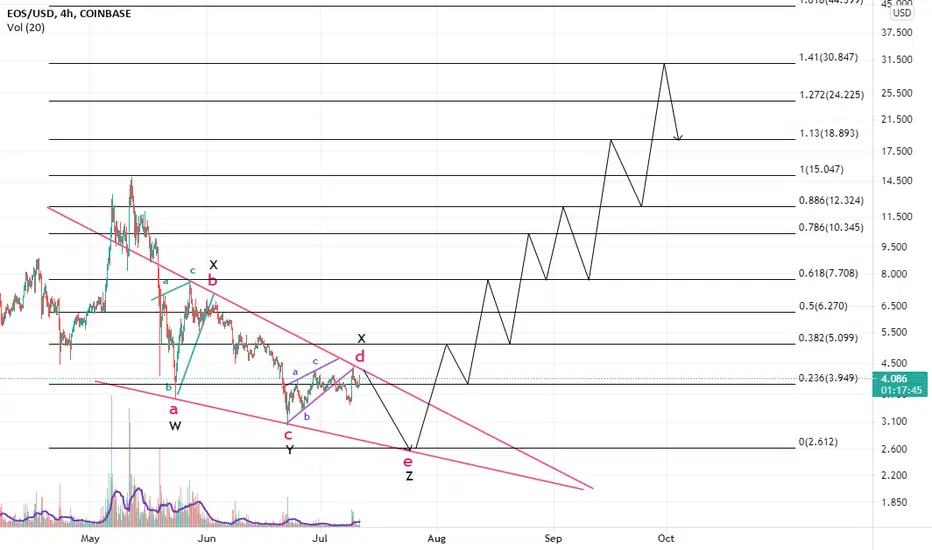
EOSUSD short It has been a while since i have posted my charts here, i had some requests to do it again
with enough feedback/ interest i will continue to do so
Now let us go to the chart
i expect eos to finish this wave lower (maybe a little push up before further downwards momentum) and hit one of my targets that are on the chart.
After this i think we get a significant bounce up.
i expect the same for BTC and XRP which i would post also
Trade Safe and always use a SL ... nothing is written in stone and the market can always surprise you!!!
If you have any questions regarding to my charts or about ew in general pls post them below and i will try to answer them asap

EOS/USD: Upward breakout possible (3W).Upward breakout possible on pattern 3W. Bitcoin is also forming pattern 3W up.
In general, altcoins are growing more actively than bitcoin:
What is a signal in favor of price growth.
