EOS (EOS) - January 18Hello?
Welcome, traders.
If you "follow", you can always get new information quickly.
Please also click "Like".
Have a nice day.
-------------------------------------
(EOSUSD 1W Chart)
(All: )
If it declines from the 2.8250 point, it is likely to enter the mid- to long-term investment zone, so you need to trade cautiously.
It must rise above the 4.0849 point to turn into an uptrend.
However, to accelerate the uptrend, it needs to break out of all downtrend lines.
It is necessary to check whether it can ascend in the volume profile section formed over the section 2.8250-6.4053.
--------------------------------------
(EOSBTC 1W chart)
(All: )
I think we are entering the mid- to long-term investment zone, with a decline from the 0.0000 856 point.
It must rise above the 0.0000 856 point to turn into an uptrend.
To continue the uptrend, it must move above the 0.0001 470 point.
------------------------------------------
We recommend that you trade with your average unit price.
This is because, if the price is below your average unit price, whether the price trend is in an upward trend or a downward trend, there is a high possibility that you will not be able to get a big profit due to the psychological burden.
The center of all trading starts with the average unit price at which you start trading.
If you ignore this, you may be trading in the wrong direction.
Therefore, it is important to find a way to lower the average unit price and adjust the proportion of the investment, ultimately allowing the funds corresponding to the profits to be able to regenerate themselves.
------------------------------------------------------------ -------------------------------------------
** All indicators are lagging indicators.
Therefore, it is important to be aware that the indicator moves accordingly with the movement of price and volume.
However, for convenience, we are talking in reverse for the interpretation of the indicator.
** The MRHAB-O and MRHAB-B indicators used in the chart are indicators of our channel that have not been released yet.
(Since it was not disclosed, you can use this chart without any restrictions by sharing this chart and copying and pasting the indicators.)
** The wRSI_SR indicator is an indicator created by adding settings and options to the existing Stochastic RSI indicator.
Therefore, the interpretation is the same as the traditional Stochastic RSI indicator. (K, D line -> R, S line)
** The OBV indicator was re-created by applying a formula to the DepthHouse Trading indicator, an indicator disclosed by oh92. (Thanks for this.)
** Support or resistance is based on the closing price of the 1D chart.
** All descriptions are for reference only and do not guarantee a profit or loss in investment.
(Short-term Stop Loss can be said to be a point where profit and loss can be preserved or additional entry can be made through split trading. It is a short-term investment perspective.)
---------------------------------
EOSUSD.P trade ideas

EOS-USD: Not a trading pointEOS-USD is not at a good point yet for trading. Don't trade in the yellow zone. wait for arrows. green for long, red for a short. if green happens, then buy everything you can.

buy the dipcypher and shark harmonic pattern:
AB=0.61 XA
BC=1.13 AB
1.27 BC=$14.14 *reached*
0.88 XA=$16.93
1.6 EF=$24.8
*1.6 BC=$26.42*
1.13 XA=$32.7
2 BC=$52.69 *final target of cypher*
2 EF=$63
2.24 BC=$81.3 *final target of shark*
2.24 EF=$113.38
1.6 XA=$122
2.6 BC=$160.95
2.6 EF=$285.5

EOS - 12 Month Candle ChartWhat do you see?
I see a 12 month chart that looks very much like a pennant with a flag pole structure... Could we really hit $90+ per EOS?

Eos bullish divergence creatingWe know market is now too much volatile....
Some opportunities are available here many alts now i find this on eos it can give a small profit in this bear market.... Never lose opportunity ...


EOSUSD (4H) Bearish breakoutHi Traders
EOSUSD (4H Timeframe)
The market is in a downtrend and we are waiting for an entry signal to go SHORT below the 2.97 support level. Only the upward break of 3.29 would cancel the bearish scenario.
Trade details
Entry: 2.97
Stop loss: 3.29
Take profit 1: 2.78
Take profit 2: 2.47
Score: 5
Strategy: Bearish breakout

EOS short-term and mid-term analysisEOS is one of those the old-school coins (from 2018) that hasn´t done much.
We expect EOS like many other coins such as XLM , XRP , BCH to do well in 2022. Don´t sleep on EOS . Once it moves, it moves fast.
Targets like in the chart.
Visiting strong buy zone (green box) is still highly probable as we expect BTC to drop in a short-term . However, if we hold, we expect an uptrend.
Feel free to drop a comment if you appreciate this analysis
No financial advice


EOS - The Sleeping Giant Is Waking UpEnd of December, when EOS was at 2.50 USD, I recommended buying it.
Since then, EOS had a good run. Sure, other coins performed better, but the giant EOS just awoke a bit late. But as he slept longer to gain strength, his power will be tremendous.
I think this chart does not need any explanation. We are looking at a massive parallel channel in the weekly chart. We are looking at a multi-year downtrend that was broken.
The channel was touched three times on the bottom, but just two times at the top. You got me?
No more words needed. 100 USD+ at the end of the year is inevitable.


The Power of "Wyckoff Pattern"It is all in the chart Baby! This is a Long Term Trade.
March 2022, EOS will hit around 9 Dollars. After that, I predict it will hit All time high around Quarter 2. This is not Financial Advise.
This is base on Technical Analysis.
For Fundamental Analysis:
Negative Fundamentals - EOS will hover around the 2 - 3 dollars area. Seems to find that area as a bottom base on Negative FA and also the decrease of Bitcoin
Positive Fundamentals - All time high Around Quarter 1, continuing to Quarter 2. Max Potential is around 50-80 Dollars (LONG TERM)

EOS starting a downtrend T.A. calls signs show we have a downtrend forming. We have a high, low, Lower high & a Lower low starting to form on EOS


EOS $~90 Realistically Still In PlayEOS is one of my favorite alts, besides XRP and DASH. It has great price history, and it did perform exceptionally well in 2017/18. It is still listed on the biggest exchanges and so therefore i still believe that this market cycle will have its turn to shine.
If we extend fib. extensions over previous bull run, where level 1 is sitting at ATH, it just so happens that level 0.236 sits on top of the rally prior to capitulation. This further confirms that levels could be respected and price to eventually reach $90, maybe a bit more but not by much.
You can also see that if we overlay the first 2017/18 rally from the recent bottom you can see that if we did something similar in length now, we would get to near $90. That is even further conformation for me for that target.
I am not a financial advisor so non of this should be taken as a financial advise. Be well
BITFINEX:EOSUSD

EOSPERPeos chart analysis with breakout from downtrend which looks to test previous support and resistance

EOS/USDT - Weekly Chart - Next Target 8$Hello guys as you can see soon this week if we break the weekly descending channel we go as a first target at the resistance line 5.48 then 8.6514. How ever it is showing a descending triangle but as alt-coins season is starting and BTC dominance is decreasing I will start buying in these days and keep half of it for 100% and the next half on 200%

EOS HISTORY REPEATS?Lets see how we slide into the new year this time.
Based on last years correction before the run in early '21, things could repeat on same scale into '22
EOSUSDWe could be in for a incredible bull run to 12$ per coin, considering the extreme price, good luck to everyone.


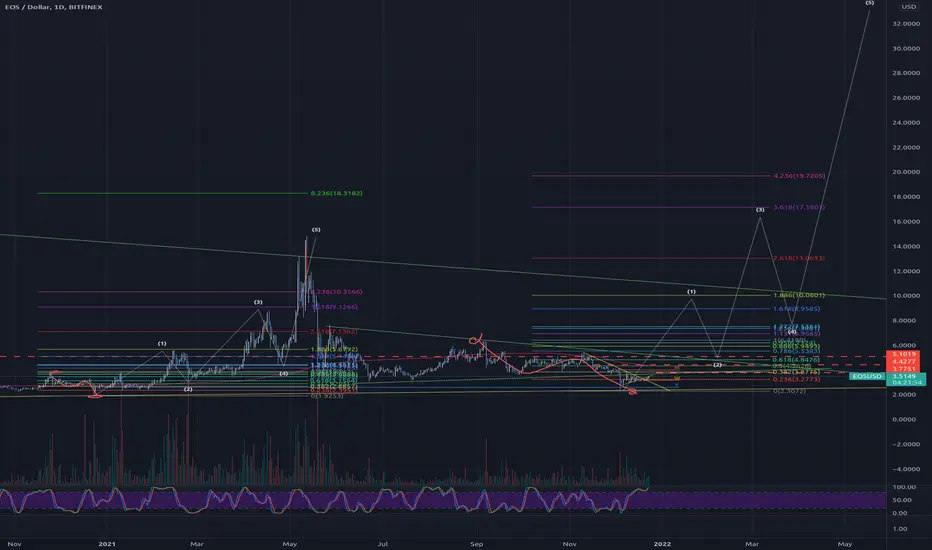
Long EOS Description as shown in the chart.
Enjoy and comment your thoughts if you like :)
Notes:
R refers to the top of the triangle line - the previous resistance
