EOS building a nice base to start the ramp higherEOSUSD is set to play catchup with other cryptocurrency pairs such as Bitcoin, Ethereum and Litecoin as price action builds a nice base. I expect that buyers will get more active with a move up through the 5.050 zone so watching to see how sellers react up at the level. The stage is set...just watching for the action to kick off.
EOSUSD.P trade ideas


EOS testing its major support level We can see that this support has been holding quite strongly for several months despite the high volatility on the market. It looks like EOS is ready to pump from here.

eos moon or should i say sun missionEos was the sister of Helios, god of the sun
Get your shades ready may be bright


EOS forward drivenEOSIO is a highly performant open-source blockchain platform, built to support and operate safe, compliant, and predictable digital infrastructures.
Weekly PA has project for us a good key support entry-level, find entry-level, TP1 & TP2 in the TA
$EOS
Trade safe...

EOS - Sleeping Giant Hi, this is my new update for EOS. EOS is one of the boring coins in cryptocurrency, but something special will happen soon and everyone will be surprised. In this analysis we have double bottom in the chart, double bottom in the MACD and double bottom in RSI, and that indicates something special will happen very soon, also a massive bullrun. If we look at the Ethereum Classic chart we see something similar in the structure for ETC between 22th February and 5th May, also a massive bullrun in ETC from $9 to $155 in 45 days and the structure that we have now in EOS. I have chosen some targets for EOS and that is possible to catch up with the rest of the market. The first target is very realistic and that is FIB 2.618 (target $50-57) and the second target is full extension in fibonacci 4.236 (target $92-100). If you think EOS is the only coin that is lagging behind and will never get any bullrun, you are WRONG. There are more coins that is lagging behind (XRP, DASH, ZCASH, BCH, LTC...), and they are going to get their ALTSEASON too, because these coins have done it in the previous altseasons and they are going to do the same thing again. I expect the top of the bullrun in TOTAL Market Cap will be done with top of these coins that are lagging behind, so be patient and don't panic ;)

EOS/USDEOS holding cup and handle patter this is a long term hold and has time before breakout.
But is one of the most undervalued coins out there that hasn't has a big move yet.
Accumulate if u can.
Not financial advise.DYOR.

EOS still on track to see $22We’ve seen this type of pattern completed in the charts of Litecoin, Cardano and others. I think EOS is still heading for its all time high of approximately $22.

EOS givng some love!EOS been sticking around here for a bit im pretty bullish on this one. Look like its wants to run it ATH due to the fact it ran so many. Eos is reasonable entry. If it continues to drop will pull back. This coin gots potential. Watch this one closely.
Please follow and like for more free analysis.
---CrptoWhale100Billion---

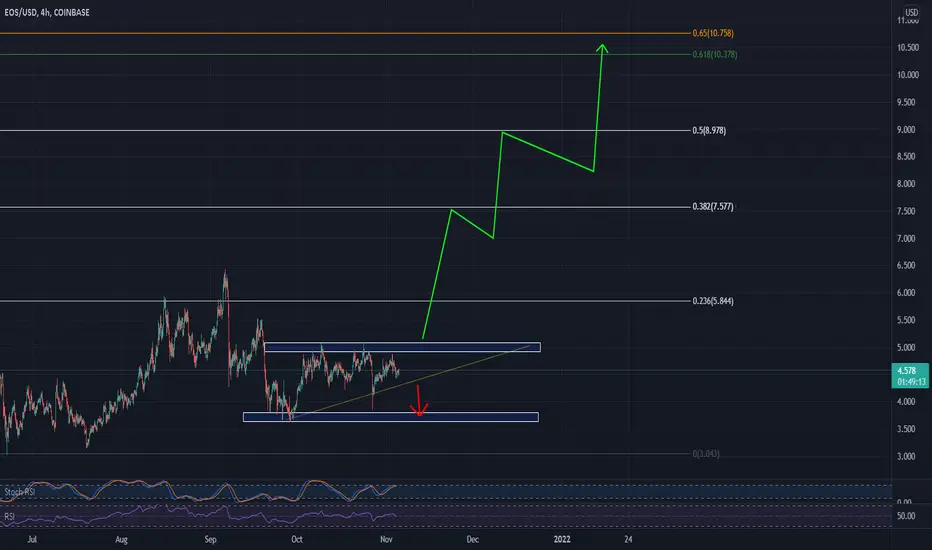
EOS - Ascending TriangleUPT:
1. 7.5
2. 8.9
3. 10.3 - 10.7 (Golden Pocket)
DPT:
1. 3.6
Price action is KING!
More power to all your trades, my friends!
Ron
Intrepid_Trader
EOS Wave.3 Start Today...!!!EOS Price Would be Double in Short Time,...
First TP is 7.60 $
Buy Today After Price Close Above Trend Line...

EOS Move IncomingEOS looks to be at an accumulation here at weekly VWAP. Typically I would exit on a daily, but I’m excited to see the weekly movement here. If this fires, it could get spicy as we race towards ATH

EOS will pump hardEOS has been in the range for 1155 days. It has a 4.236 fib level of around $96
nothing else to say...

EOS UpdateEos is getting ready to pump, first target is $7. All Time High is coming for this lagger.

MY NOT SO MINIMALIST ANALYSIS FOR EOSIO$EOS
11.01.21
0920H +8 SINGAPORE
THROWBACK THURSDAYS
ALERT: ENTRIES, PARTIAL EXITS, EXITS, and MAXIMIZED AREAS OF VALUE
THIS IS AN AREA OF OPPORTUNITY: A ZONE FOR AN ENTRY.
We must watch out for a PIGS TAIL (COIL.)
I call this accumulation maturity just like wine. hehe. It must not break below the bottom of a major and minor box (SUPPORT), but be aware that coils often take a plunge low and go parabolic or simply achieve our EXIT ARE OF VALUE.
We saw a failed AB=CD Pattern but now RSI is almost OVERBOUGHT.
Disclaimer:
The findings of the following analysis are the sole opinions of the publisher of this idea and should not be taken as a piece of investment advice.
"FOLLOW THE WHITE RABBIT!"
HOW TO USE THIS MINIMALIST CHART
Created on a MONTHLY, WEEKLY & DAILY Analysis (The Dynamics of the Market.)
It is designed for SWING TRADES at the BOTTOM. I do not SHORT, though, you can still use it.
TARGET ZONES IDENTIFICATION
The LARGE BOXES (Tops and Bottoms) are MAJOR pivot points that will occur sometime in the future. While the SMALL BOXES (Tops and Bottoms) are MINOR pivot points.
These can be entries to a BUY/ SELL POSITION, EXIT/PARTIAL EXIT/TOP-UP AREAS
and if you wish to hold longer for a MAXIMUM TARGET EXIT AREA OF VALUE -CONSERVATIVE (If price action conditions are right.)
At times I include WAY BEYOND PARABOLIC Price TARGETS depending on The Character of the Market.
Watch out for your Volume, Chart Patterns, Candlestick Math, FIB COILS (ABC), Price Action, FIB LEVELS, Market Dynamics, and especially trading psychology.
Wishing you all The Best Trades and Thank you all for your Appreciation and Support of My Work.
Much thanks to My 3 Mentors!
Note:
Master your Trading Discipline
and Trader's Psychology
Vive Le Austist!

Eos on bulish newsEos bullish exchange launch news
Over the past couple of days, the EOS Coin has seen a significant jump in price. The EOS cryptocurrency rose up more than 50 per cent on May 11, 2021, as per the WazriX chart. Just a few weeks ago in March, the EOS crypto was trading at a price of #3.50. At the time of writing this article, the price of EOS reached an all-time high of $14.83, as per the WazirX exchange. The EOS Coin has given significant returns to investors this year. Is EOS Coin a good investment? Read on to know EOS Price Prediction.

MY NOT SO MINIMALIST ANALYSIS FOR EOS.IO$EOS
10.30.21
0900H +8 SINGAPORE
ALERT: ENTRIES, PARTIAL EXITS, EXITS, and MAXIMIZED AREAS OF VALUE
AN AREA OF OPPORTUNITY: ZONE FOR AN ENTRY (I call this PIGS TAIL for COIL)
Disclaimer:
The findings of the following analysis are the sole opinions of the publisher of this idea and should not be taken as a piece of investment advice.
"FOLLOW THE WHITE RABBIT!"
HOW TO USE THIS MINIMALIST CHART
Created on a MONTHLY, WEEKLY & DAILY Analysis (The Dynamics of the Market.)
It is designed for SWING TRADES at the BOTTOM. I do not SHORT, though, you can still use it.
TARGET ZONES IDENTIFICATION
The LARGE BOXES (Tops and Bottoms) are MAJOR pivot points that will occur sometime in the future. While the SMALL BOXES (Tops and Bottoms) are MINOR pivot points.
These can be entries to a BUY/ SELL POSITION, EXIT/PARTIAL EXIT/TOP-UP AREAS
and if you wish to hold longer for a MAXIMUM TARGET EXIT AREA OF VALUE (CONSERVATIVE (If price action conditions are right.)
At times I include WAY BEYOND PARABOLIC Price TARGETS depending on The Character of the Market.
Watch out for your Volume, Chart Patterns, Candlestick Math, Price Action, Fibs, Market Dynamics, and especially trading psychology.
Note: That This CHART is best used without indicators.
Master your Trading Discipline
and Trader's Psychology
Wishing you all The Best Trades! I thank you for your Appreciation and Support of My Work.
Much thanks to My 3 Mentors!

#EOS E.O.S = Exact Opportunity Specially .. for you I'm accumulating in EOS starting from the current price 3.94 till 3.4
it is a long term one
targets in green
4.2
5
5.6
6.3
7.2
8
9
12.7
15.7
if you wanna use stoploss try weekly close below 3 $, I'm not .
if my time calculation was right, October gonna be it's month

EOSUSD (Daily) Bullish ReversalHi Traders
EOSUSD (Daily Timeframe)
Waiting for the upward break of $5.074 resistance level, which will complete a bullish trend reversal pattern to go LONG. Only the downward break of $4.189 would cancel the bullish scenario.
Trade details
Entry: 5.074
Stop loss: 4.189
Take profit 1: 5.542
Take profit 2: 6.377
Score: 7
Strategy: Bullish Reversal

EOS- bull confirmation above 5.50. Hi folks,
Been a while but I was quite impressed with the art work on this one so thought I’d give it an idea.
Bullish momentum in BTC can only mean good things for alts to come. EOS has been wedged since the yearly high around $15. Currently price has been stuck between 2 trend lines , daily target looks to break 5$ to reach 5.50$.
If a Weekly candle closure ends above 5.50$ then EOS has a huge potential upside to previous ATH.
Trade with caution, a rejection at 5$ Again on the daily and we could form a new LL at 3.50-3.80$. (Should BTC head into low 50s again).
Daily chart is visible so please don’t bore me with the it’s going down whilst you analyse the 15 minute candles.
Peace out and drop a like if you don’t mind!

Eos (EOS) - October 25Hello?
Welcome, traders.
By "following", you can always get new information quickly.
Please also click "Like".
Have a nice day.
-------------------------------------
(EOSUSD 1W Chart) - Mid-Long-Term Perspective
Above section 5.1-6.4053: Expected to make a new wave.
(1D chart)
It is important to keep the price above the 5.1 point.
In particular, it is necessary to check whether it can break through the volume profile section formed near the 6.4053 point upward.
If the price is maintained above the 6.4053 point, the uptrend is expected to accelerate.
If it falls from the 3.6732-4.0849 range, it may touch near the 2.8250 point, so trade cautiously.
------------------------------------------
(EOSBTC 1W Chart) - Mid-Long-Term Perspective
Above 0.0003040 point: expected to continue uptrend
(1D chart)
It is important to maintain the price by rising above the 0.0000856 point.
A rise above the 0.0001470 point is expected to continue the uptrend.
------------------------------------------
We recommend that you trade with your average unit price.
This is because, if the price is below your average unit price, whether it is in an uptrend or in a downtrend, there is a high possibility that you will not be able to get a big profit due to the psychological burden.
The center of all trading starts with the average unit price at which you start trading.
If you ignore this, you may be trading in the wrong direction.
Therefore, it is important to find a way to lower the average unit price and adjust the proportion of the investment, ultimately allowing the funds corresponding to the profits to regenerate themselves.
------------------------------------------------------------ -----------------------------------------------------
** All indicators are lagging indicators.
Therefore, it is important to be aware that the indicator moves accordingly with the movement of price and volume.
However, for the sake of convenience, we are talking in reverse for the interpretation of the indicator.
** The MRHAB-O and MRHAB-B indicators used in the chart are indicators of our channel that have not yet been released.
(Because it is not public, you can use this chart without any restrictions by sharing this chart and copying and pasting the indicators.)
** The wRSI_SR indicator is an indicator created by adding settings and options to the existing Stochastic RSI indicator.
Therefore, the interpretation is the same as the traditional Stochastic RSI indicator. (K, D line -> R, S line)
** The OBV indicator was re-created by applying a formula to the DepthHouse Trading indicator, an indicator disclosed by oh92. (Thanks for this.)
** Support or resistance is based on the closing price of the 1D chart.
** All descriptions are for reference only and do not guarantee a profit or loss in investment.
(Short-term Stop Loss can be said to be a point where profit and loss can be preserved or additional entry can be made through split trading. It is a short-term investment perspective.)

EOS Bullish MACD Confirmation of future rally?MACD has spiked with volatility...
Are we seeing a bullish charge to the upside?
All indicators would suggest so.
This is not financial advice.
