MY MINIMALIST CHART ANALYSIS FOR $EOS$EOS - EOS ON A DAILY CHART
5.10.21 0456H +8 PACIFIC
MY PRACTICE MINIMALIST ANALYSIS
ENTRY AND EXIT POINTS FOR A SWING TRADE
USING RANGE BOXES AND FIBS
Note:
Run your Fibs at the top and bottom of
the big and small range boxes together
with your chart for your target exits and
stop-loss.
This is not a piece of financial advice.
I am just a student and still learning.
Adjustments will be made in
accordance with The Dynamics of the
Market along with Trading Psychology.
Caution, Trade what you see and not
trade what you think.
Postings are done most of the time will be
delayed, as it takes time for me to finish
on several assets.
Updates will be posted religiously if time
permits.
EOSUSD.P trade ideas

Eos to 11$ at least then possible correction to.618 fibBullish but obviously a good potential dip buy opportunity


$4 Billion War ChestSome people are going to be sad soon seeing the "dead chain" pass their favourite chain in marketcap!

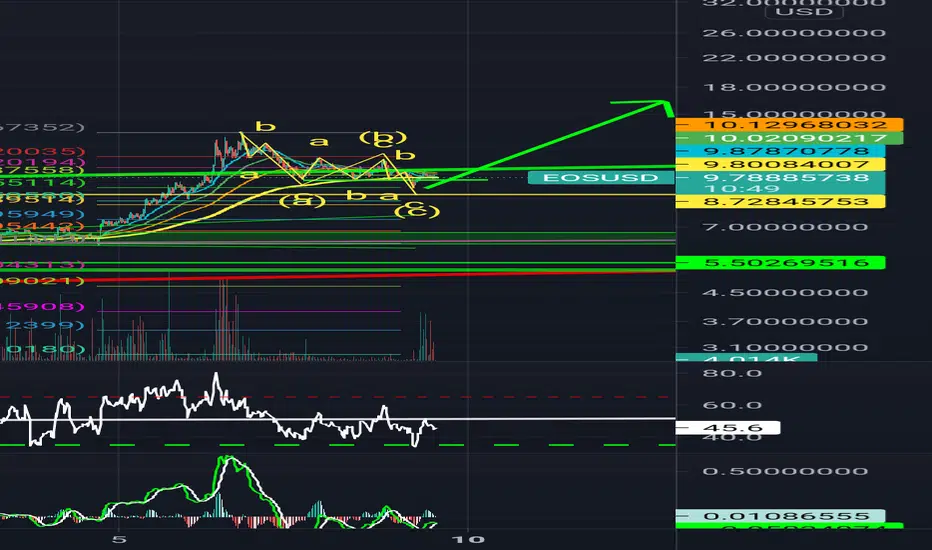
Correction over?Looks like we could have a complete ABC pullback.
The C leg is kind of stunted and shorter so it's possible we get one more little leg down to $8.30, but anything past that would start to threaten our uptrend, which would be a major surprise.
EOS has been very supportive so far and it's alt season is just starting. Think of the goal! Where are we going?
Don't worry about the bumps along the way.
I'm going for $40 then $80 then $120.
Then I plan to sell, watch everything crater and everyone lose hope and think crypto is dead. And when everyone says it's dead, YOU BUY!!!
Think of the dot com bubble.
This is extremely similar.


#EOS For long-term investment
The currency is expected to reach its targets by the end of this year
Price Now : 5.8$
Targets
- 23$
- 25$
Patience is everything in this area
Do not forget to join us on the channel, the link is provided below and in the bio
Good Luck
Old Signal

EOS - 5/8 - Bull Flag - 55%+Bull Flag breakout would put us up about 55% - Price target $15.90 - watch volume for breakout confirmation.
*I am not a financial advisor*

$EOS Potential Reversal Trade Setup
Lets hope the drop continues another while to give a better entry for even better gains on the reversal.

Double bottomEOS may have found a double bottom. Wait for neckline break on the hour timeframe. Target is listed but may want to take profits at the fib level before.
DYOR and GL!
Bearish Pattern Detected - Watch out for this before longingHi guys,
My previous bullish analysis on EOS has been a great success and the price had reached well over my targeted price range.
I believe we are currently in a bearish triangle above. If we break above it then we will see the price range up to $13 range but if we break down then we will go to our next support which is around $9.50. If this support holds then it will go up to $13 and then to ATH. It's also important to analyze the EOS/BTC chart which shows EOS gaining a lot of traction against BTC.
I don't recommend shorting in a bull market but watch out before you go long at these levels. I expect a retrace. Daily and 4hr RSI is still in overbought category. Trade with caution, this is not financial advice.

EOS is rising again.Looks like the pullback may be over. We retraced to the 50% mark and have broken out and retested on the RSI.
Send it.


Eos (EOS) - May 8Hello?
Dear traders, nice to meet you.
By "following" you can always get new information quickly.
Please also click "Like".
Have a good day.
-------------------------------------
(EOSUSD 1W chart)
(1D chart)
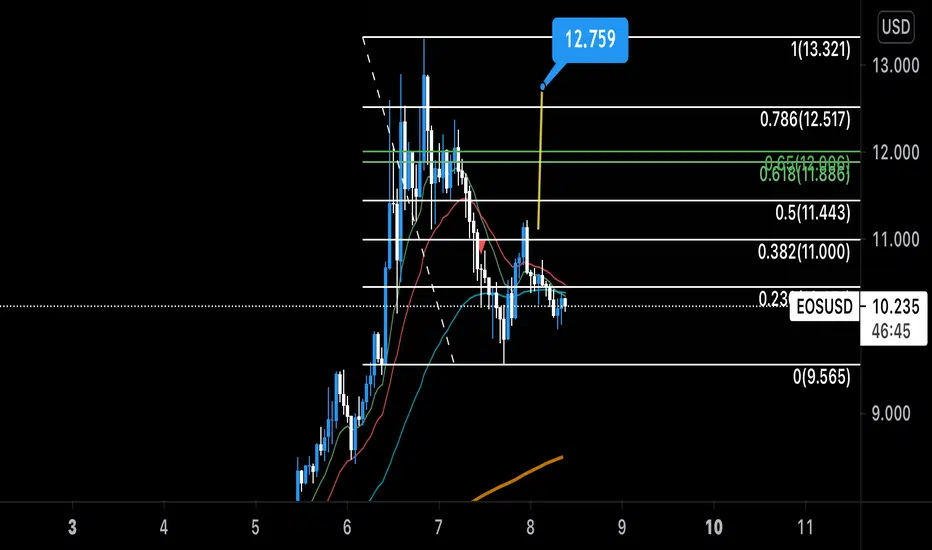
We'll have to see if we can get support and climb from 10.1764-10.7363.
If it falls, we need to make sure we get support at 9.05.
It remains to be seen if it can rise above the 12.7530 point, which is an important point.
If you move down at 8.4968, you need a short stop loss.
-------------------------------------
(EOSBTC 1W chart)
(1D chart)
1752 Satoshi-1874 Satoshi should be watched for any movement deviating from the section.
If it falls, we need to make sure we get support in the 1569 Satoshi-1630 Satoshi section.
--------------------------------------
It is advisable to trade at your average unit price.
This is because if the price flows below your average unit price, which was on an uptrend or downtrend, there is a high possibility that you will not be able to earn a large profit due to the psychological burden.
The center of every trade starts with the average unit price you start trading.
If you ignore this, you may be trading in the wrong direction.
Therefore, it is important to find a way to lower the average unit price and adjust the proportion of the investment, so that the money that ultimately corresponds to the profit can regenerate the profit.
-------------------------------------------------- -------------------------------------------
** All indicators are lagging indicators.
So, it's important to be aware that the indicator moves accordingly with the movement of price and volume.
Just for the sake of convenience, we are talking upside down for interpretation of the indicators.
** The wRSI_SR indicator is an indicator created by adding settings and options from the existing Stochastic RSI indicator.
Therefore, the interpretation is the same as the conventional stochastic RSI indicator. (K, D line -> R, S line)
** The OBV indicator was re-created by applying a formula to the DepthHouse Trading indicator, an indicator that oh92 disclosed. (Thank you for this.)
** Check support, resistance, and abbreviation points.
** Support or resistance is based on the closing price of the 1D chart.
** All explanations are for reference only and do not guarantee profit or loss on investment.
Explanation of abbreviations displayed on the chart
R: A point or section of resistance that requires a response to preserve profits
S-L: Stop Loss point or section
S: A point or segment that can be bought for profit generation as a support point or segment
(Short-term Stop Loss can be said to be a point where profits and losses can be preserved or additionally entered through installment transactions. It is a short-term investment perspective.)
GAP refers to the difference in prices that occurred when the stock market, CME, and BAKKT exchanges were closed because they do not trade 24 hours a day.
G1: Closing price when closed
G2: Cigar at the time of opening
(Example) Gap (G1-G2)

EOS in Bearish ..Opportunity to buy in dipAs per my analysis and historical trend..opportunity to buy EOS in Dip
1st Support- at $9 (Buy here)
if this comes below $9 then,
major support- $ 6.45- Buy here ..safest point.
Soon, this will hit ATH - $18, wait till then

Parabolic EOS?after busrting toward cup and handle target in just one day, EOS is consolidating and moving toward historical broken resistance (now support?!) at highlighted green area. the chart seems totally parabolic in weekly time frame and there's a chance the new upcoming weekly candle only touches the new support and head back toward new ATHs in upcoming weeks.
this is personal idea and should not be considered as signal or anything.
wish everyone happy trading.
siavosh.

This thing's gonna FLY!!Long term EOS is bound for greatness.
Plus we just moved +12% straight up off of support.
Definitely want to buy a pullback maybe soonish.


EOSUSD 07 MAY 2021 1042 hrsSame situation as usual. Profit/supply coming into the market that is overcoming the demand.
We need the supply to dry up and for the demand to increase. Look for that to happen around key support areas and enter with the background.
Additional TA info on other charts. Will follow up.

