EOSUSDFrom the Technical Perspective:
1. From the Monthly perspective, EOS was rejected from the major level of supply zone (8.597), expecting a continuation to the downside.
2. From the Weekly perspective, EOS created an impulse to the downside with a retracement, we can expect a continuation to the downside.
3. From the Daily perspective, EOS is approaching the major supply area (6.804~6.618), we can expect a continuation to the downside from this region.
4. Overall direction from the Multi-Timeframe Analysis: BEARISH
How to approach EOSUSD?
1. Currently lower timeframes are indicating a bullish market, multiple HH (Higher High) and HL (Higher Low) are formed. We can looking for the long opportunity at the moment and targeting the supply area (6.804~6.618), if your rules of the strategy are fulfilled.
2. Once the price reached the supply area, we can looking for the short opportunity inside the supply area.
The result might not follow my analysis, this analysis is based on the TA & FA perspectives.
Comment down below let me know your view on EOSUSD or which pairs you would like to me analyze in the future.
Kindly visit my profile and get more free analysis every single day.
EOSUSD.P trade ideas

Eos (EOS) - April 28Hello?
Dear traders, nice to meet you.
By "following" you can always get new information quickly.
Please also click "Like".
Have a good day.
----------------------------------
(EOSUSD 1W chart)
(1D chart)
You should watch for any movement that deviates from the 5.1376-6.2573 segment.
In particular, we have to see if we can get support at 6.4053, an important point.
If it falls at the 4.7538 point, a Stop Loss is required to preserve profit and loss.
However, it may rise along the uptrend line (1), so careful trading is necessary.
-----------------------------------
(EOSBTC 1W chart)
(1D chart)
We have to see if we get support and rise at the 1086 Satoshi point, which is an important point.
--------------------------------------
It is advisable to trade at your average unit price.
This is because if the price flows below your average unit price, which was on an uptrend or downtrend, there is a high possibility that you will not be able to earn a large profit due to the psychological burden.
The center of every trade starts with the average unit price you start trading.
If you ignore this, you may be trading in the wrong direction.
Therefore, it is important to find a way to lower the average unit price and adjust the proportion of the investment, so that the money that ultimately corresponds to the profit can regenerate the profit.
-------------------------------------------------- -------------------------------------------
** All indicators are lagging indicators.
So, it's important to be aware that the indicator moves accordingly with the movement of price and volume.
Just for the sake of convenience, we are talking upside down for interpretation of the indicators.
** The wRSI_SR indicator is an indicator created by adding settings and options from the existing Stochastic RSI indicator.
Therefore, the interpretation is the same as the conventional stochastic RSI indicator. (K, D line -> R, S line)
** The OBV indicator was re-created by applying a formula to the DepthHouse Trading indicator, an indicator that oh92 disclosed. (Thank you for this.)
** Check support, resistance, and abbreviation points.
** Support or resistance is based on the closing price of the 1D chart.
** All explanations are for reference only and do not guarantee profit or loss on investment.
Explanation of abbreviations displayed on the chart
R: A point or section of resistance that requires a response to preserve profits
S-L: Stop Loss point or section
S: A point or segment that can be bought for profit generation as a support point or segment
(Short-term Stop Loss can be said to be a point where profits and losses can be preserved or additionally entered through installment transactions. It is a short-term investment perspective.)
GAP refers to the difference in prices that occurred when the stock market, CME, and BAKKT exchanges were closed because they do not trade 24 hours a day.
G1: Closing price when closed
G2: Market price at the time of opening
(Example) Gap (G1-G2)

WAY TO $6 and up trend is coming soonbest position to get in.
not an advice do your own analysis
thanks you

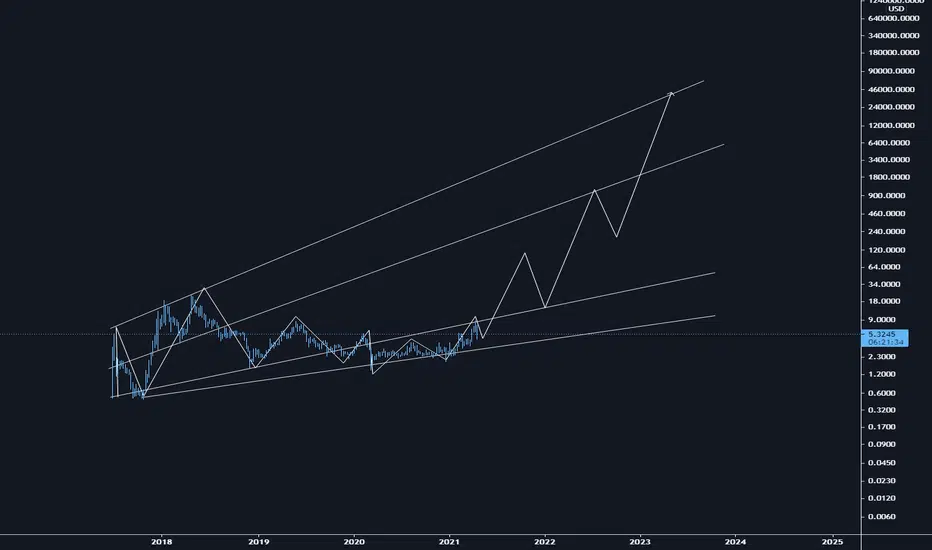
EOS | parabolic-rise to 50k (before 2030)| JBPredictionsFrom my point of view, EOS is an ignored and undervalued project, which, before 2027-2030, according to my perspective, could reach prices like 30k. This is my bet (LOL).
In another hand, we're almost in alts 3rd wave. EOS has completed triangule- breakout + 2nd wave longterm + wykoff accumulation ...
As 3rd wave -longterm, I am expecting a big movement to 30-50k before 2030.
We bought at 2-3.5 zone.
Targets: 800, 2k, 10k, 40k, 50k.
EOS: BULLISH IMPULSE AND BUY STOP TRIGGER READY ! 🔔Welcome back Traders, Investors, and Community!
If you LIKE this analysis, Please support our page by hitting the LIKE 👍 button
Traders, if you like this idea or have your own opinion about it, please write your own in the comment box . We will be glad for this.
Have a Good trading day!


EOSUSD: Where EOS is heading? (Logarithmic)Chart is self-explanatory & it is not a financial advice anyhow. Take it or leave it! :-)
Please check my previous posts on everything! I do not consider the technicals only.


$EOS $EOSUSD entry PTs 3.50-4.25 PT 9-13EOS is the native cryptocurrency for the EOS.IO blockchain platform with smart contract capabilities. The company Block.one created EOS.IO in September 2017 and it now has over 100 dapps with thousands of daily active users. It enables decentralized apps, or dapps, to be created by software developers. The platform is more scalable than many other blockchain networks, with the ability to process one million transactions per second without any fees. Its dapp development capability makes EOS similar to Ethereum with the notable distinction that transaction confirmations are done through a different type of consensus system. Block producers are chosen by the EOS ecosystem through a voting mechanism known as delegated-proof-of-stake (DPoS). In order to vote, users must stake tokens for three days without selling them, putting them at risk of losing money should the price of the token drop during that time. There is no maximum supply limit of EOS tokens. The delegated proof-of-stake model uses inflation, capped at 5% annually, to fund transactions and pay block users.

EOS. 1st ever attempt using Gann Fann. It's a disgrace.I have absolutely no clue what I'm doing. I watched one youtube video, now I'm trying to use this Gann Fann to help predict the future. I don't think it's working, but maybe Jesus is real. Someone smarter than me would probably know.
I did include a thick arrow to clear up any doubts though. You're welcome.

EOSUSD Buy SignalPattern: Channel Up on 1D.
Signal: Buy once the price enters the 1D MA50 (blue trend-line) and 1D MA100 (green trend-line) Zone. The RSI is already waving a bull flag for those who seek more risk.
Target: 12.350 - 15.250 (depending on where the low will be in order to calculate the 1.786 Fibonacci extension).
** Please support this idea with your likes and comments, it is the best way to keep it relevant and support me. **
--------------------------------------------------------------------------------------------------------
!! Donations via TradingView coins also help me a great deal at posting more free trading content and signals here !!
🎉 👍 Shout-out to TradingShot's 💰 top TradingView Coin donor 💰 this week ==> tradertrain
--------------------------------------------------------------------------------------------------------

EOS UNLIMITEDEOS/USD looking like it's hit a bottom from the previous dip & it's ready to make another move to the upside.
As you can see from the chart, there is a solid triple bounce off of support and a breakout from the recent down trend.
Also, from the lower VWAP you can see that it crosses the zero line & there is an extremely sharp wave signifying a sharp move to the upside.
This trade is a relatively low risk trade & looks like it should play out in the next few days.
If Bitcoin continues to lose it's dominance going into May, EOS & other alts should see massive gains.
Not financial advice!


EOSBULLIt's almost time. Professional traders have a way of sweeping through every orifice of a market and squeezing every ounce of profit out of it.
Expect that they won't leave these ones alone. Especially since you know they were Previously there. Happy >100x to you. GL HF.
EOSBULL
XRPBULL
LTCBULL
BCHBULL
BSVBULL
XLMBULL
(Maybe even TRXBULL)


EOSUSD A great buying opportunity with one last hurdleHI everyone,
EOSUSD has been consolidating for a long time but pitchfork identified that it broke its pitchfork downward structure.
It does need momentum and i have identified levels where some strong volume expected.
The first agressive level to buy is at 3 dollar. Weekly trend support and close to pitchfork outer boundary
The second entry would be confirmation entry at 5 dollar.
5 dollar level is strong horizontal resistance which is the last hurdle before it reaches 15 dollars.
The chart look beautiful and perfectly alligned with the pitchfork.
the Weekly trendline is holding this pair nicely.
Some details are mentioned on the chart as well.
Enjoy trading this pair
Have a great day
PLease like and subscribe for more analysis.

EOS is on Sale! Support Held!Look at that. We pulled back right to the .382 and defended it like a boss!!
Seems like we hit my support zone pretty spot on and are now turning back upward. MACD looks good and the RSI has a crossover and retest.
We pulled back almost exactly to the previous wave 4, and that pink line connects to the previous highs which we're now still holding above. As long as we hold above 5.50 the bullish case stands.
Multiple confluent factors say this is a buy for me.
Just picked me up a bunch at $6.15. Booyah.
My target for this bull cycle is $110, but hopefully if goes much much higher.
Have high hopes for EOS, XLM, and STAKE. All competitor blockchains to ETH.
Not financial advice.

EOSUSD Short Fall Could have a chance of falling in the area of 127-138 of the fibonacci retracement
This Fall is just temporary before it market breaks previous high
Still going bullish in the long term.

EOS USDEOS just breakout and its look super duper bullish.i just bought at 6.25$ with close stoploss. Next 8$ is strong resistance .ALT market just picking up momentum.
Take profit @ 8$
Take profit @ 15$
Take profit at @21.50
i am not financial advisor .


Fractal says we're gonna moon.Looks at the circled i in wave 1.
It's a fractal of the whole structure I swear.
That wave retraced right to the same place we crashed too...
It's on sale right now.

I like it.EOS is tough. Sold off right to the 4th wave and has bounced right back up into the channel. We have to hold $7 for the bullish case to be valid.
Technically this could be an ABC pullback, so if we fall back down out of the channel, look out.
