EOS Price Projects A Gain Of More Than 20%The weekly technical chart for EOS showcases a bullish momentum. On coming to the daily chart,EOS price is showing signs of positive bullish momentum. EOS price is trading above 50 and below 100 Moving Average.The 50MA price is at $4.22, making it temporary support for the coin. The coin's resistance on the upside will be at $6, and on the downside, it will see a bounce back from $4. EOS is currently inside a trapezium in the daily chart . If the price breaks 10% above the upper line, then a robust bullish momentum can be seen. EOS can see an uptrend be $6 in the upcoming days.
Kindly comment your thoughts here
EOSUSD.P trade ideas

Ready for EOS ?Higher lows then the Downtrend(pink Line) is broken, re-test has done of this line, now the channel target is about 96$, these are my opinions and its not an advice just for education to myself :) Lets see if it works ;)


EOSUSD: The Elliots, the Cup & Handle has been formed?The market has gone bullish again while Bitcoin is cooling off.
Weekly Elliot Waves Analysis is implicating that we are halfway up toward the end of the 3rd impulsive wave.
Price has been channelized as shown. Reactions to Dynamic-Static S&Rs have been shown.
If you have checked my previous analysis on EOS I have mentioned that an upward breakout has happened.
Weekly Stochastic Relative Strength Index (SRSI) has made a HL after 8 Weeks. A proof for a high potential for price to increase.
5.6 a previous peak is formed on the Static-Dynamic Resistance with the latter right on the midline of the 2nd ascending channel.
Please pay attention that during a bullish run prices precipitate to form layers specially following several years of a downturn.
Psychologically traders do expect higher prices at the moment.
Technically, professional traders find such set ups interesting with high potentials. So, more buyers will take it over until bitcoin is consolidating.
The Cup & Handle shows the possible peak of the 3rd wave. Just right there are two tings: one static resistance & one more midline dynamic resistance.
If wave counting has been done correctly higher targets can be nailed.
It is not a financial advice. You need to consult your financial advisor. Trading bears a high risk of loosing your money.

EOSUSD: How PAST can INDICATE FUTURE? An EXAMPLE!If you have checked on my previous posts you should have seen that Weekly & Daily Cypher structure. I have tested the Elliots & Fibs., I have tested descending & ascending price channels & Dynamic - Static S&Rs. Meaning I have put in test every technical theory affordable to the best of my knowledge to let those less experienced "Traders" know:
1. "Previous/past performance CAN (its modal like anything else) be an INDICATOR for FUTURE performance." How?
2. The abovementioned is contradicted "when" an equity has no Fundamentals - it is a broken company or something tremendously wrong has happened. Otherwise, why on earth many can possibly say that Past performance is not an indicator of a future prosperity?
3. Dan Larimar is gone. So true. What was there for such a brilliant mind to do there in EOS? Creative minds cannot be imprisoned in one single workplace. Still, EOS needs to cooperate with some more talented, or I would say brilliant minds to find better grounds in the industry.
4. The market reacted to this news. Yet, EOS has technically a huge potential to be utilized more in a decentralized atmosphere online. For those of you who has no knowledge on its network & considerable potentials please start to learn.
5. This crypto may sound too complicated & that can hinder its liquidity since "many prefer not to learn how it is being transferred & used". Instead there are wallets which can easily stake some EOS for CPU, RAM & NET.
6. Based on an analogy that I have posted here about a comparison between 2017 number of active wallets & the present time, more & more people will join our community. Also, many youngers are going to learn about the "ecology" of cryptos. They are going to be far more knowledgeable on Cryptos Applications, trading them for Technical & Fundamental reasons and some even unknown aspects of Decentralized Utilizations like Social Media, Quantumic Computational Capacitators & things that we absolutely have no idea about NOW.
7. Dear Traders do rely on what you know & learn from others based on two important things when you see technicalists analyzes here:
7.1. Stay in HARMONEY & KEEP silent & SKIM, SCAN & READ what others post freely here thanks to tradingview team.
7.2. Get out of the circle of your personal safety & learn HOW TO CONTRAST & DIALECT with people of your own kind on the other hand. We are not supposed not to challenge ourselves & others. Yet, respect stands first when WE THINK something "SEEMS" WRONG.
8. There is a field of study called "Data Science". Therein, the utmost important PILLAR is called ANALYTICS. For Analytics to be of virtue Quantities has to have a highly premium Quality. Then, sufficiently scientific data form information & they in turn form Insights & the more qualified insights shape an actual multidimensional perspective toward any subject which can be named INTELLIGENCE.
9. Having read all the story up there, we need to find not only our own Trading Style, but we need to form a "Multidisciplinary Ontology or Philosophy" for Financials, Investment & Trading. A one-eyed perspective like Technical Analysis would be a paralyzed & deficient approach to get gains in the markets: Gold, Real-estates, Stock Shares, Cryptos & Currency Pairs.
So, when a newcomer asks how lucrative is a specific chart, or when you are working for your company &/or investors you really appreciate what you know from Computers (this damned truly Black Monster Science - a exemplary of our damned ever questioning & challenging human brains), you will be Resourceful & your answer will be Really Rewarding for those who have stamina to generate actual money inhere. Yet, you should give them insights.
Thanks to you & thanks to tradingview's talented & studious people. I wonder why we cannot pay for tradingview by cryptos yet, though I have asked them on LinkedIn?
Ask, Think, Delve into it, Develop, Check, Do, Recheck, Categorize & Infiltrate every thing.
There is no limit to what we are capable of dreaming, questioning & analyzing, and eventually MATERIALIZING.
Let's do it. :-)


EOS/USD ANALYSprice is in bullish channel which now we are in bottom. i think at first we can have rich the demand area which i point in diagram and than after rest we can break it out for reaching the top of channel.
what do you think? i will be happy to know your opinion. BITFINEX:EOSUSD

EOSUSD D1: BEST Level to SHORT IT 20/40% gains(SL/TP)(NEW)Why get subbed to me on Tradingview?
-TOP author on TradingView
-15+ years experience in markets
-Professional chart break downs
-Supply/Demand Zones
-TD9 counts / combo review
-Key S/R levels
-No junk on my charts
-Frequent updates
-Covering FX/crypto/US stocks
-24/7 uptime so constant updates
EOSUSD D1: BEST Level to SHORT IT 20/40% gains(SL/TP)(NEW)
IMPORTANT NOTE: speculative setup. do your own
due dill. use STOP LOSS. don't overleverage.
Tagged as SHORT as I expect more losses
short and mid term.
🔸 Summary and potential trade setup
::: EOSUSD daily chart review
::: heavy rejection on daily timefram
::: BEAR flagging on daily chart
::: expecting 20%/40% correction
::: shorting from KEY S/R level is good
::: BEARS will target recent cycle lows
::: TP Bears is +20%/40% gains
::: targets based on swing extensions
::: get ready to short from highs
::: and get paid bears
::: recommended strategy: SHORT IT TP 2.40 USD
::: short near market / short rallies/rips
::: SWING TRADE: SHORT/HOLD IT
::: correction not over yet
::: good luck traders!
::: SHORT and get paid. period.
🔸 Supply/Demand Zones
::: N/A
::: N/A
🔸 Other noteworthy technicals/fundies
::: TD9 /Combo update: N/A
::: Sentiment mid-term: BEARS
::: Sentiment outlook short-term: BEARS
RISK DISCLAIMER:
Trading Futures , Forex, CFDs and Stocks involves a risk of loss.
Please consider carefully if such trading is appropriate for you.
Past performance is not indicative of future results.
Always limit your leverage and use tight stop loss.

Ready for EOS ?Higher lows then the Downtrend(pink Line) is broken, re-test has done of this line, now the channel target is about 96$, these are my opinions and its not an advice just for education to myself :) Lets see if it works ;)

EOS - Elliot Wave MapI'm speculating based on Elliot Wave Strategy.
Disclaimer
All investment strategies and investments involve risk of loss. Nothing here should be construed as investment advice. Any reference to an investment's past or potential performance is not, and should not be construed as, a recommendation or as a guarantee of any specific outcome or profit.

EOS vs ETH & BTCI'm speculating based on the last BTC Bull Run, EOS appears to still yet make its move. I used the 6 day average "since there is no Weekly average" for EOS and compared current runs while reflecting on the past bull run.
Disclaimer
All investment strategies and investments involve risk of loss. Nothing here should be construed as investment advice. Any reference to an investment's past or potential performance is not, and should not be construed as, a recommendation or as a guarantee of any specific outcome or profit.

eos ideaafter that crazy dip , looks like this coin is back to channel. accumulation looking solid buying a small position 200 coins. this is not a recomendation

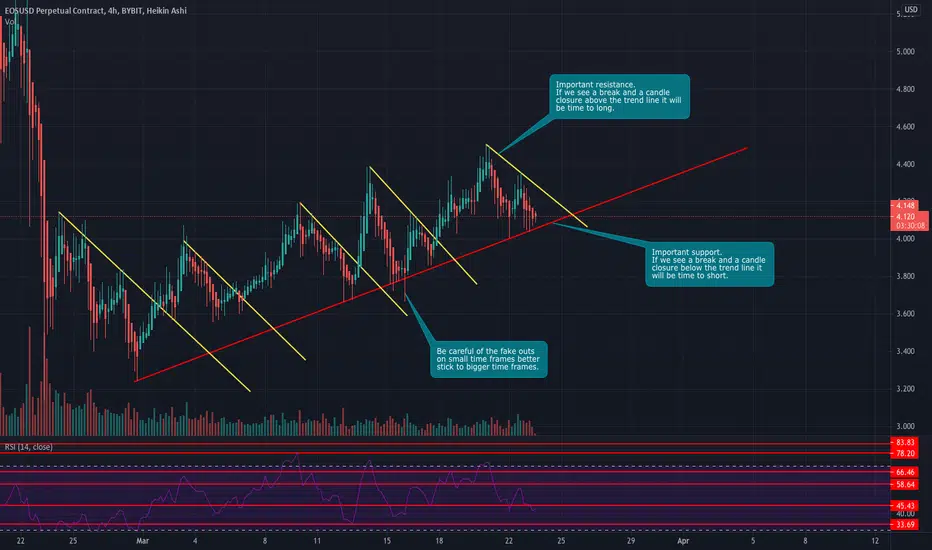
EOSUSD Easy Money Making StrategyHello everyone, if you like the idea, do not forget to support with a like and follow.
Simple plan by just waiting a break of either trend lines (red or yellow).
You can see that we are on this type of looping a long time now a break of the trend line that is holding us down (yellow) and then we make a new high.
If we see a break of the the important trend line (red) that is holding the uptrend it will be a good short to enter, be careful of the fake outs wait for full candle closure and retest of the line before entering the short.
Thank you for reading my post, have a great day, wish you all the best !
Information provided is only educational and should not be used to take action in the market.
Feel free to ask anything in the comments :)
EOSUSD: A True or False Breakout?Finally the dynamic resistance is broken out. FYI, that is the 12th one. I await a true trend reversal here. I hope. ;-)


EOS, long the pullback.This entry would be wonderful...
I don't think weekly resistance (purple line) will hold another test. It might just pump from here actually but I don't recommend buying resistance. But in either case the next weekly resistance would be the target.

Eos (EOS) - March 29Hello?
Dear traders, nice to meet you.
By "following" you can always get new information quickly.
Please also click "Like".
Have a nice day.
-------------------------------------------------- -----
We have to see if we can get support and ascend at the 4.0849 point.
If it falls, we need to make sure it is supported at 3.8859.
If it falls at the 3.6722 point, a Stop Loss is needed to preserve the profit and loss.
-------------------------------------
(EOSBTC 1D chart)
We have to see if we can ascend above the 748 Satoshi point.
-------------------------------------------------- -------------------------------------------
** All indicators are lagging indicators.
So, it's important to be aware that the indicator moves accordingly with the movement of price and volume.
Just for convenience, we are talking upside down for interpretation of the indicators.
** The wRSI_SR indicator is an indicator created by adding settings and options from the existing Stochastic RSI indicator.
Hence, the interpretation is the same as the traditional Stochastic RSI indicator. (K, D line -> R, S line)
** The OBV indicator was re-created by applying a formula to the DepthHouse Trading indicator, an indicator that oh92 disclosed. (Thank you for this.)
** Check support, resistance, and abbreviation points.
** Support or resistance is based on the closing price of the 1D chart.
** All explanations are for reference only and do not guarantee profit or loss on investment.
Explanation of abbreviations displayed on the chart
R: A point or section of resistance that requires a response to preserve profits
S-L: Stop Loss point or section
S: A point or segment that can be bought for profit generation as a support point or segment
(Short-term Stop Loss can be said to be a point where profits and losses can be preserved or additionally entered through installment transactions. It is a short-term investment perspective.)
GAP refers to the difference in prices that occurred when the stock market, CME, and BAKKT exchanges were closed because they do not trade 24 hours a day.
G1: Closing price when closed
G2: Cigar at the time of opening
(Example) Gap (G1-G2)

EOS may resume it's uptrend to a previous $5.50 highEOS had a virtually uninterrupted rally from $2.50 on January 28th to the high of $5.50 on February 13th. After dropping to a low of $3.17 on February 23rd, EOS made four attempts to rally, achieving 4 sucessive higher highs on March 3, 9, 13, and 20th. Unusually strong up days on March 1, 9, 13, 16, and 26th potentially reveal accumulation patterns by institutional accounts. It pays to follow the money, in my opinion. I don't currently have a position in EOS, but this may change in the future.

EOS possible LONG-watch short term to confirm trend before entry4hr broke below trend when BTC fell to 50K. If EOS/BTC bottom holds, this could be a great long with huge upside potential.
