EOS ready for a new bull run The weekly chart of EOS highlights a bearish momentum.On coming to the daily time frame EOS price is below 50 and above 100 Moving Average.The 50 MA (Red) line is at $4.11 making it temporary resistance for the coin. Resistance of the coin on going upside can be seen at $ 4.5 and on the downside bounceback can be seen from $3.5.An Accumulation zone is being formed in the Monero on the shorter time frame of 4-hour chart.If the price goes above $4.2 then a huge buying rush can be seen in the coin.EOS/USD pair can see a bullish move in the upcoming days.EOS/BTC pair can also see an uptrend in upcoming days.
Kindly comment your thoughts below
EOSUSD.P trade ideas

EOSUSD Is going to be one of the biggest hitters this year! 1HRBeen following EOS for some time since it came out.
I have a projection of 25+ by July easily.
Short term $5 is inbound in for sure!
Anything dealing with Ethereum has my attention.
Ethereum will be over 30k by 2022-23.. :)
Lets get it baby! Super excited

EOS target 6 USDEOS / BTC is in a steady uptrend despite of the decline of BTC vs the dollar! This is one of the best signs an altcoin can have. When EOS breaks 4.5 it will fly to 5.5, if it breaks 5.5 it can actually fly straight to 8 usd.

EOSUSD: What MA's are implicating?When MAs cross like that a truly bullish rally can be just a start. Then, holding this new stable coin seems inevitable.

EOS Testing Major ResistanceTesting this resistance again - the more we test the more likely it will break. Hoping to break over and get a nice resistance support flip before tracking up to the recent high before the end of the month.
-dependant on how BTC performs
-have not surpassed this resistance since the initial February drop
-not much resistance until the recent high after this resistance
-upwards trend this month

Eos (EOS) - March 23Hello?
Dear traders, nice to meet you.
By "following" you can always get new information quickly.
Please also click "Like".
Have a good day.
-------------------------------------------------- -----
We need to see if we can get support at the 4.0849 point and climb along the uptrend line.
If it falls, we need to make sure we get support at 3.7849.
In particular, it remains to be seen if it can rise along the uptrend line (2).
If you fall from the 3.7849 point, you can touch the 2.8250 point, so you need a Stop Loss to preserve profit or loss.
If it is supported in the important section of 3.7849-4.1343, it is expected to rise.
-------------------------------------------
(EOSBTC 1D chart)
We must see if we can get support from 748 Satoshi and rise above 784 Satoshi.
In particular, we have to see if we can cross the 759 Satoshi-972 Satoshi section.
-------------------------------------------------- -------------------------------------------
** All indicators are lagging indicators.
So, it's important to be aware that the indicator moves accordingly with the movement of price and volume.
Just for the sake of convenience, we are talking upside down for interpretation of the indicators.
** The wRSI_SR indicator is an indicator created by adding settings and options from the existing Stochastic RSI indicator.
Therefore, the interpretation is the same as the conventional stochastic RSI indicator. (K, D line -> R, S line)
** The OBV indicator was re-created by applying a formula to the DepthHouse Trading indicator, an indicator that oh92 disclosed. (Thank you for this.)
** Check support, resistance, and abbreviation points.
** Support or resistance is based on the closing price of the 1D chart.
** All explanations are for reference only and do not guarantee profit or loss on investment.
Explanation of abbreviations displayed on the chart
R: A point or section of resistance that requires a response to preserve profits
S-L: Stop Loss point or section
S: A point or segment that can be bought for profit generation as a support point or segment
(Short-term Stop Loss can be said to be a point where profits and losses can be preserved or additionally entered through installment transactions. It is a short-term investment perspective.
GAP refers to the difference in prices that occurred when the stock market, CME, and BAKKT exchanges were closed because they do not trade 24 hours a day.
G1: Closing price when closed
G2: Cigar at the time of opening
(Example) Gap (G1-G2)


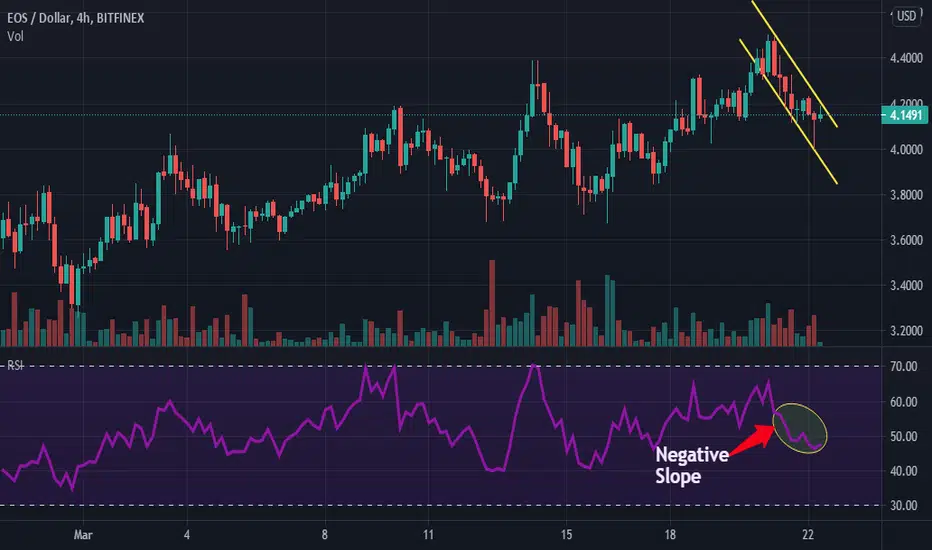
Where Does The Future Of EOS Price Heading?
EOS price is trailing at $4.18 with a loss of 1.77% in the intraday session.EOS coin will face resistance ongoing upside at $4.5 and a bounceback from $4.EOS weekly chart suggests bullish momentum. The daily chart of the coin suggests a consolidated momentum. It is trading above 50 and 100 Moving Average. The 50MA(yellow) is at $4.04, making it temporary support for the coin. On coming to the shorter time frame of the 4hour chart, the price is seeing a Bearish rally inside a downward parallel channel. If the price breaks 5 to 10% above the channel, then a strong bullish rally can be seen.
Resistance:$4.5
Support:$4
Kindly Like and Follow Us
EOS Nice Uptrend Might Be EndingHello everyone, if you like the idea, do not forget to support with a like and follow.
A simple plan to trade this channel will be by just following these two rules.
A break and a candle close of the resistance trend line will lead us to the upside target.
A break and a candle close of the support trend line will lead us to the downside target.
Wide placement of the stop losses above the resistance and below the support will be a good idea to avoid stop loss hunting.
Also trading within the range is possible just long and the support trend line and short the resistance trend line.
But for how long this channel will hold ? Time to start investigating what might end this channel.
EOS showed good strength and we are on a beautiful money making ascending channel by longing the support trend line and shorting the resistance trend line, but are we closing to a downwards break ?
We can't know for sure so we have to count everything that we spot.
I am talking about the cypher pattern (if you are not familiar with it, i've attached a link for a more in depth explanation and a very nice video also ) as you can see from the trend based fib extension that i have on the chart starting fro the 3.245$ level and ends on the 4.075 point the 1.272 and 1.414 levels are exactly where the price is rejecting on a cypher pattern by only wicking the region that means heavy shorters are present on the area.
I believe that we might have a cypher pattern forming here, if not we have to take it as consideration at least to our trading plans.
For a more in depth understanding of the cypher pattern you can check this link forexop.com
and also this youtube video www.youtube.com he really explains it pretty well.
Thank you for reading my post, have a great day, wish you all the best !
Information provided is only educational and should not be used to take action in the market.
Feel free to ask anything in the comments :)

SELL LIMIT AT 4.46CRYPTO SIGNAL:
📊EOS/USDT 📉 SELL LIMIT 4.46
📍SL 4.6020
✅TP 4.4020
✅TP 4.30
✅TP 4.15
Leverage 10x


Nice path to 5$I see lots of space for improvement here in the short run. Do you guys think we'll have the chance to see the price go to 5$ by the end of the month?

EOS Has a LOT Of Potential In Terms Of % GainsIn terms of percentage gains EOS has a lot to go. We probably wont see prices below $6, maybe even higher, but that is just my opinion from what i see on a chart. Where are at a beginning of a alt season so it is hard to miss a coin that would not have some kind of % gains in it, but to find the right one, you have to look from a bigger perspective so you can see what it has done in the past. History tends to repeat itself so as human psychology imo.
From the chart perspective, 4.236 fib. extension takes us as high as $93, but in my opinion prices between 50 and 70 are more likely to be reached. It could just surprise us all and go even a bit higher than $100, but quite unlikely imo. We first have to break above $8.6 resistence line, from where we were rejected and couldn't reach for almost 2 years now. Breaking above this (blue) line would confirm the explosion in price, but will see.
The predicted price is just a representation from a 2017/18 alt season and does not mean it will go exactly like that.
I am not a financial advisor so don't buy anything that a say. Wish you all successful investment.
BITFINEX:EOSUSD

EOS LONG TERM İDEAhello everyone.
I would like to share my long-term idea with you from an investor perspective.
Good days will come.
I wish you good profits.

EOS ready to go to the moooooon!Everything is perfect, a great opportunity can be proposed for EOS !


EOSUSD Triangle pattern forming possible brakeout soonHi guys EOSUSD Triangle pattern forming possible brake out soon, I am leaning towards a long trade but anything could happen in the markets.
Please trade carefully and remember this is not financial advice and I am not your financial adviser, do your own research before investing this is just my opinion.

Golden cross on dailyThe MA 5 and 10 are going to cross the 30, usually this signals a strong bullish momentum change.

Republish - EOS Bullish Pennant Formation on the 2 HrBullish pennant formation on the 2 hour timeframe. Approaching the apex and looking for bullish confirmation.

Crypto Market & EOSUSD Technical Analysis & Predictions 3/18/21*DISCLAIMER: I am not a financial advisor and this is not financial advice or a recommendation to buy or sell as these are purely my opinions and speculations. I may also own or trade any of the symbols and cryptocurrencies mentioned in this video so do not make your trading or investing decisions based on this video. I do not guarantee any results nor am I responsible for your actions. You should always do your own due diligence before trading or investing in this market as it is extremely risky. Affiliate links are also included in this same video description section here and if you decide to support me by using any of them, I may receive a referral bonus or commission.
*Follow me for the latest cryptocurrency analyses on my watchlist
*Thank you to those who donated, I very much appreciate it.
*Let me know in the comment section if you agree or disagree, would love to hear your ideas too.

Is EOS ready to pump.There is a saying that the race is not for the swift but those who can endure it. The question is, is EOS even in the race or just observing from the side lines? I think it is time for EOS get in the race. A 10x move would be welcomed. First target is based on Lord Skin's price projection formula.

