EOSUSD.P trade ideas

EOS Wyckoff IdeaThe latest decline seems to be showing some strength with shorts not making further progress to the downside. This could be the last point of support with the accumulation phase finally over with. EOS seems to be a laggard, in comparison to other coins. The long duration of consolidation may suggest a new all time highs will be under way.

EOS Long, to 8$ journey in next 20 Days I expect BTC will stable or increase for a while. Lets see where we will go with EOS. 8$, %100 is not far away.


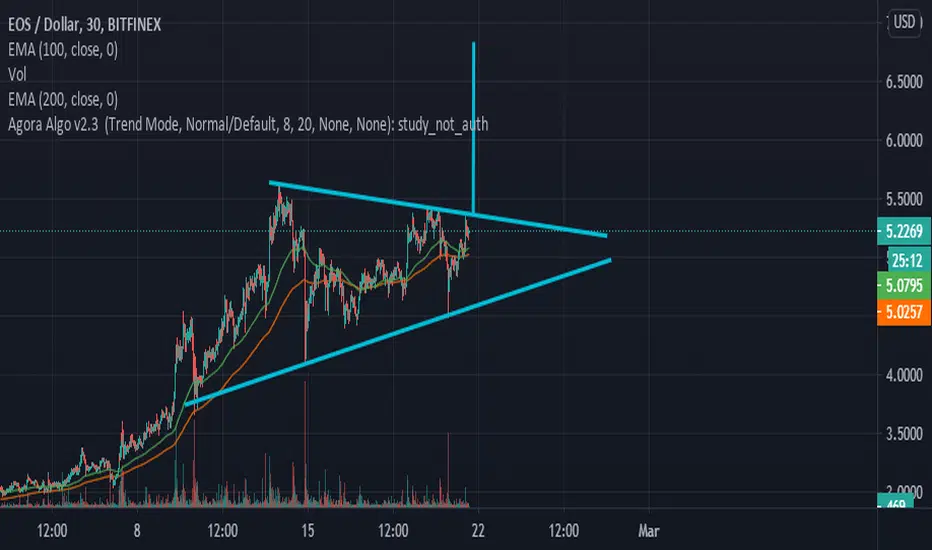
BROKE A 2 YEAR ACCUMULATION: LAST CHANCE TO BUY BEFORE MOON.EOSUSD BROKE A TWO YEAR ACCUMULATION. 1 MONTH CANDLE; FEBRUARY CANDLE CLOSES TONIGHT LEAVING A TOP LIQUID RANGE THAT NEEDS TO BE FILLED @ 5.50
CURRENTLY THE WEEKLY CANDLE SHOWS THAT IT HAS RETRACED BACK INTO THE BROKEN ZONE.
WHEN THIS CANDLE CLOSES BEARISH AT THE BROKEN RESISTANCE, THE NEW MONTHLY (MARCH) CANDLE WILL OPEN.
MARCH CANDLE WILL FILL THE TOP FEBRUARY WICK RANGE @ 5.50 NEXT PRICE TARGET IS AROUND 7$
THIS IS THE LAST PULLBACK BEFORE THE SLINGSHOT.
1:7 RR MINIMUM; PROJECTED TO GO MUCH HIGHER.
GOOGLE IS A BLOCK DEVELOPER ON THE EOS BLOCKCHAIN.

Stuck in a bearish market ready to explode to 90$Still stuck in a bearish market and ready to explode.
According to the fibonacci I can see the 90$. EOS is now for years stuck in the bearish market, ADA, BTC, DOGE, ETH, they all got out of it.
There are still coins waiting down there like BCH or ZCASH. They have massive potential.
Why buy ETH for a 20% gain if you could buy BCH for example for a 1000% gain. From 1800$ ETH to 2000$ ETH is only a 22% gain.
I wish y'all good luck!
:D


EOS/USD LongCompleting d leg of harmonic bat pattern
Fiannly broke .382 fib level
Closed above 50 ema
TP 1 - $4.00
TP 2 - $4.75


My EOS BuyPlease, DYOR.
This is my personals trade idea.
EOS followed BTC in this dip. But SL not hit. Still in play
I will look on how BTC react near the .618 fibb. If BTC want to go down again I will close trade at 4.583.
If BTC want to go over 53k.
target 1 : 6.117
target 2 : 6.929
On this charts using the Buy signal (Green + white diamond) Is Cryptovac. A paid indicator but a seriously strong indicator. I can put you in contact with the Owner.
It also show resistance and support.

EOSUSDIt is currently in the support range. Stabilization below this range or exit from the channel can be considered as a stop loss.

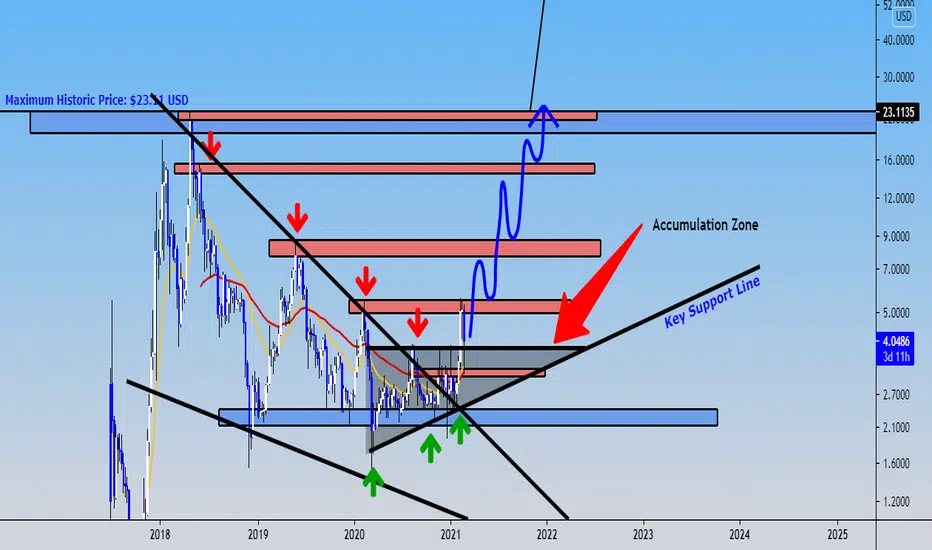
I bought EOS contract for this bullish panoramic!!!I want to make an overview of macrotrend to know what it's the next movement on EOS.
There's an intersting movement what EOS can to make in the future following this model and market structure in the weekly chart that I draw with blue brush. As we look, this it's so bullish for this crytpocurrency in the next weeks to months. And we break out this ascendent triangle of accumulation. For that, I decide to bought 400 EOS contract in my Ethereum account and 150 EOS contract in my Chainlink account, both in my broker what I choose Simple FX . Remember, you can to trade Forex, cryptocurrencies, stocks, commodities and others financial markets. But just, I use this broker to trade crytpocurrencies.
Now, I change my Cardano contract for EOS because EOS it's in the lower zone of accumulation than Cardano, that it's very soon to break out the maximum historic. For that, EOS it's a great opportunity to accumulate or bought. I'd reccomen to trying to bought EOS contract, and this it's all, you don't need to make nothing.
But, I see in my opinio that EOS it's not bearish, it's extremely bullish toward the long term, and for that I decide to chagne my Cardano contract for EOS contract based in what EOS it's in the good and excellent point to accumulate, and also, the fundamental analysis are very good.
And finally, this it's the monthly chart, I want to show you this forecast price what EOS it's so prepared for the next bull run that it's begining in the next weeks to months. I have these targets: $100 USD, $300 USD, $500 USD and $1,000 USD
Guys, if you like this overview, I invite to share this analysis with your friends, tradrs or people who hold EOS!!! And soon, I will going to take time to create a new topic of EOS about what it's this crytpocurrency.
EOS, THE GIANT IS COMING.Hi guys, I have very few words to spend on this Crypto because it speaks for itself.
EOS has accumulated for long time, and now we are back to a the MOTHER liquidity level.
You remember this analysis on IOTA? Wyckoff accumulation is now completed on EOS!
Please do your own research on investments and follow your trading plan.

EOS is full sleeping.Mate.
nothing to TA, other than simple support and resistances. volume looks good. volume looks really good.
This thing is primed and ready to pop.
soon.
it's one of the few coins that are yet to full send it.
full bloody send it.
I remember back in 2017 when this first came out, everyone was saying that it'll be the next ETH. i say. who the hell cares. if it makes you money. you buy it.
it appears that accumulation is not quite finished, but is entering final stages.
mark up is nigh.
HODL


Eos (EOS) - February 24Hello?
Dear traders, nice to meet you.
"Like" is a huge force for me.
By "following" you can always get new information quickly.
Thank you for always supporting me.
-------------------------------------------------- -----
We have to see if we can get support by climbing to the 3.7849-4.0849 section.
In particular, it remains to be seen if it can rise along the uptrend line (2).
If it falls in the 3.3252-3.5232 section, a Stop Loss is required to preserve profit and loss.
We need to see if it can rise above the 4.2674 point to turn to an uptrend.
-------------------------------------------------- -------------------------------------------
** All indicators are lagging indicators.
So, it's important to be aware that the indicator moves accordingly with the movement of price and volume.
Just for convenience, we are talking upside down for interpretation of the indicators.
** The wRSI_SR indicator is an indicator created by adding settings and options from the existing Stochastic RSI indicator.
Hence, the interpretation is the same as the conventional Stochastic RSI indicator. (K, D line -> R, S line)
** The OBV indicator was re-created by applying a formula from the DepthHouse Trading indicator, an indicator that oh92 disclosed. (Thank you for this.)
** Check support, resistance, and abbreviation points.
** Support or resistance is based on the closing price of the 1D chart.
** All explanations are for reference only and do not guarantee profit or loss on investment.
Explanation of abbreviations displayed on the chart
R: A point or section of resistance that requires a response to preserve profits
S-L: Stop Loss point or section
S: A point or segment that can be bought for profit generation as a support point or segment
(Short-term Stop Loss can be said to be a point where profits or losses can be preserved or additionally entered through installment transactions. It is a short-term investment perspective.)
GAP refers to the difference in prices that occurred when the stock market, CME, and BAKKT exchanges were closed because they do not trade 24 hours a day.
G1: Closed price
G2: Market price at the time of opening
(Example) Gap (G1-G2)


EOSUSD D1: Best level to BUY/HOLD 35%/65% gains(NEW)Why get subbed to to me on Tradingview?
-TOP author on TradingView
-15+ years experience in markets
-Professional chart break downs
-Premium content
-not just random lines on the chart
-Supply/Demand Zones
-TD9 counts / combo review
-Key S/R levels
-No junk on my charts
-Frequent updates
-Covering FX/crypto/US stocks
-24/7 uptime so constant updates
EOSUSD D1: Best level to BUY/HOLD 35%/65% gains(NEW)
IMPORTANT NOTE: speculative setup. do your own
due dill. use STOP LOSS. don't overleverage.
Tagged LONG because I expect strong BOUNCE
off the lows, HOWEVER read entire idea
before executing. DO NOT market BUY now.
🔸 Summary and potential trade setup
::: EOSUSD 1days/candle chart review/outlook
::: right now CORRECTION MODE
::: DO NOT BUY NOW
::: BUY/HOLD setup for 35%/65% gains
::: will bounce from confirmed horizontal
::: key S/R level (4 reversal)
::: BUY HOLD setup for BULLS 35%/65% gains
::: expecting S/R to get hit in March
::: within 3-4 weeks
::: 2.20 USD is BEST reload BULLS
::: BULLS should seek to BUY LOW
::: 35%/65% gains possible for BUY/HOLD
::: this is BUY/HOLD Setup
::: for patient traders only / no fast gains here
::: good luck traders
🔸 Supply/Demand Zones
::: N/A
::: N/A
🔸 Other noteworthy technicals/fundies
::: TD9 /Combo update: N/A
::: Sentiment short-term: BEARS/CORRECTION
::: Sentiment outlook mid-term: BULLS/65% gains
RISK DISCLAIMER:
Trading Crypto, Futures , Forex, CFDs and Stocks involves a risk of loss.
Please consider carefully if such trading is appropriate for you.
Past performance is not indicative of future results.
Always limit your leverage and use tight stop loss.


EOSUSD 1WLarge volume breakout candle last week.
Price quickly retraced from the support around 4.2
Supports and resistances marked.

EOS Breakout imminent - Target 1 $6.8 ? Looks like EOS is about to breakout and target 1 would be $6.8 and then beyond!