EOSUSD.P trade ideas

EOS 1D: Elliott Wave Analysis👋 Hello and welcome traders to another trade idea with SunnyHillCapital
☝️ Firstly, if you like what you see, please support our work by writing a comment and SMASH that like button! 👍 Let's catch these moves together! ✅
💡 Why should you follow our profile on TradingView?
Consistent chart updates
Clean charts
Short and long-term perspectives
Visually teaches you valuable lessons
High probability setups
Analysis on a wide range of major markets
SMASH that follow button! 👍
💡 Leave a comment and/or message us on how we can improve and provide better content, we are open to suggestions to create a better experience for you!
Keep in mind that the analysis provided is not 100% accurate and that you can never be certain with the markets. This information given is not financial advice, always do your own research.
Thank you for reading,
Cheers to many pips! 🤝

EOS EOSUSD - Rounding bottom + NEW ATH soon!- This is my analysis for EOS, a lot of poepole asking about why EOS is not pumping.
- On the chart we can see a rounding bottom or cap and handle formation, which is bullish.
- After a rectangle consolidaton, the price started with an Impulse Elliott wave.
- First target 1:1 / below all time high.
- RSI is ready and volume favors bulls.
- For expected duration of the trade, probability, stop loss, profit target, entry price and risk to reward ratio (RRR) - please check my signature below ↓
- If you want to see more of these ideas, hit "Like" & "Follow"!

EOS/USDT - Potential 180%+ setupHello, Traders!
EOS is trying to exit the accumulation range of $3.76 to $5.46. The price is testing the $5.46 level and MA100 on the daily timeframe.
Volume analysis shows growth of buyers' interest in the asset.
It is possible to get involved in buying in case of a correction. It is better to divide the entry into two parts:
The first part of the position can be accumulated in the range of $4.42 - $4.94.
The second part of the position is in the range of $3.76 - $4.24.
Stop-loss shall be placed under the level of $3.12
It is also possible to fix profit in case of growth in parts, in the ranges:
$6,62 - $7,04
$8,75 - $9,50
$11,16 - $11,95
Good luck and watch out for the market
P.S. This is an educational analysis that shall not be considered financial advice

EOS is next (this one is risky bcs of btc being stupid)EOS pump is next on the waiting list of altcoin pumps, I expect atleast a 30% pump but since it is highly dependable on btc and btc is at a good resistance I would say to keep monitoring BTC while keeping EOS long, currently XRP is running

$EOS again undervalued after hitting my $15 targetEOS, after touching my $15 target, did exactly what I would have wanted it to do, which was retrace its steps. I personally did not expect him to go that deep but that has been a convergence with Bitcoin. Fortunately, I indicated several times on Twitter that I was taking a big TP at $15 because a retracement is always coming. What goes up, must come down.
Now looking forward to EOS, I am still very positive and very surprised that this coin is still valued so low. The fundamentals of EOS are also getting better with bullish exchange in sight.
Therefore, I expect EOS to show considerable price action in the coming months and weeks and possibly reach a new ATH before the end of the year.

Bullish PennantTriangle breakout which is bullish pennant pattern breakout looking for bullish long.

EOS looking for new ATHi believe EOS will fly once btc allows alts to move .my target will be first its ATH which is 23 then i will be waiting for the channel res reaction to decide .#BULLISH i just wanted to show u an overall view . BITFINEX:EOSUSD

EOS Completed CyclePUT YOUR MONEY WHERE YOUR MOUTH IS!
EOS has had several painful hype cycles that led nowhere, but now finally theres something great to look out for! The EOS Foundation!

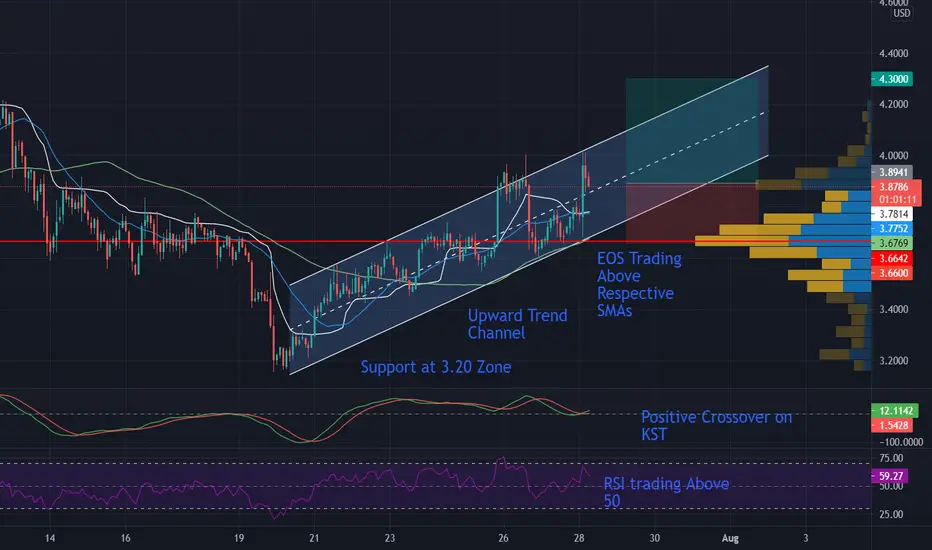
EOS Channelling Higher with 4.3 TargetTrend Analysis
The main view of this trade idea is on the 2-Hour. The cryptocurrency EOS found some support around the 3.20 price level on July 20th 2021 and began making higher highs and higher lows over the past week. This chart pattern appears to be a trend channel. EOS is expected to continue to move higher towards 4.3 in the short term. A negation of this move will be a close below 3.66.
Technical Indicators
Along with the upward trend channel, EOS is also currently above its short (25-SMA), medium (75-SMA) and fractal moving averages. Recently there was a positive crossover on the KST and the RSI continues to trade above 50. Since the rally off from 3.20 lows, the cryptocurrency’s RSI has mostly been below overbought territory.
Recommendation
The recommendation will be to go long at market. EOS’s target price is around the 4.30 price level and its indicative stop loss is around the 3.60 level, near the higher low of the trend channel. This produces a risk-reward ratio of 1.73.
Disclaimer
The views expressed are mine and do not represent the views of my employers and business partners. Persons acting on these recommendations are doing so at their own risk. These recommendations are not a solicitation to buy or to sell but are for purely discussion purposes. At the time publishing, I have a position in EOS .
EOS - Shorterm #SM.DUNZA-EOSUSD-30min-3TP #BYBIT #EOSUSD
Close long position if opened.
OPEN NEW/ADD TO SHORT POSITION
Enter around: 4.635
TAKE PROFIT:
4.561, 4.519, 4.417,
STOPLOSS:
4.728,
We recommend moving stop loss to break even once the first TP is hit
Signal issued on 2021-08-12T21:30:00Z

EOS100 trades crypto series
Starting date: 9/August/2021
Day 4
Starting capital: $500
Capital at present: $583
Trade nr. 14
(all trading ideas in the series with commentary and outcome can be found on my profile)
As bitcoin sentiment turned a little bit to the bearish side all my today's trades were SHORT.
Also I was luck enough to catch the BTC market cap dominance rising in a short term which was also a good indicator that alts will bleed.
As I am looking now, it is probably the weakest trade I made, because of the many bullish points.
BEARISH VIEW:
-Mega strong selloff made me believe that we are going down.
-bear flag
BULLISH VIEW:
-Strong bull wicks at the bottom of the range
-Strong support zone (blue line) haven't been breached (only have by wicks)
-Might convert to a trading range instead of another leg down.
From the retrospect, the stop was incorrect, but i decided to extend my stop/loss manually and see what will happen (decided to risk some more money)
Better entry probably would be at the 50% retracement rejection.

EOS going beyond $5All right, we can see that the price managed to break the resistance of the up channel yesterday which started around $3. Bulls pushed the price above $5 mark yesterday and then we witnessed a correction to 4.60 due to a profit-taking interest among the traders. Buyers reloaded at 4.60 and we can see that EOS is forming a good support at $4.80 now (which was the top of the channel before).

Broken Resistance - New SupportBulls have pushed recently and the price bounced back up from 50 MA (blue line) as expected. The bounce brought the price back to the up channel. The resistance at 4.50 has been broken and now EOS is finding good support there getting ready for its next move to the upside.

False Breakout, Support at 50 MAWe can see that bears tried to break down the up-channel on 4 hours chart, however bulls are still in control and EOS has found a good support at 50 MA (blue line) and it could not get broken for the past several days. Also, we can see MACD lines are about to cross each other soon and the orange line to go below the blue line which confirms buying signal. Following these indicators, we could expect the price getting back to the up-channel and eventually breaking the next resistance at 4.50 mark.

EOS/USD | Rising ChannelEOS is trading within a large rising channel. Watch for a pullback to the channel support.
If price breaks down out of the channel expect to see much lower.

It didn't even start yet..I will be waiting for your likes and comments, and also I appreciate your attention.


Eos (EOS) - August 7Hello?
Welcome, traders.
By "following", you can always get new information quickly.
Please also click "Like".
Have a nice day.
-------------------------------------
(EOSUSD 1W Chart)
If the price is maintained above the 4.0849-5.1 range, it is expected that the uptrend will continue.
(1D chart)
If the price holds in the 3.6732-5.1 range, it is expected to turn into an uptrend.
To continue the uptrend, it must move above the critical point of 6.4053.
If it falls from the 3.6732 point, you will enter the mid- to long-term investment area, so careful trading is required.
--------------------------------------
(EOSBTC 1W chart)
If it rises in the 8560 satoshi-30400 satoshi section, which is the bottom box section, it is expected to create a new wave.
If the price holds above the critical point of 14700 Satoshi, we expect the uptrend to continue.
Looking at the big picture, if it rises above the 47210 satoshi-53210 satoshi section, it is expected to break out of the trough section.
(1D chart)
It remains to be seen if the 9970 Satoshi-11130 Satoshi section can support and rise.
If the price is maintained above the 11130 Satoshi point, it is expected to turn into an uptrend and rise.
If it falls from the 9970 Satoshi point, there is a possibility of entering the mid- to long-term investment area, so careful trading is required.
However, it is possible to touch near the 8560 Satoshi point and rise, so be prepared for this as well.
------------------------------------------
We recommend that you trade with your average unit price.
This is because, if the price is below your average unit price, whether it is in an uptrend or in a downtrend, there is a high possibility that you will not be able to get a big profit due to the psychological burden.
The center of all trading starts with the average unit price at which you start trading.
If you ignore this, you may be trading in the wrong direction.
Therefore, it is important to find a way to lower the average unit price and adjust the proportion of the investment, ultimately allowing the funds corresponding to the profits to regenerate themselves.
------------------------------------------------------------ -----------------------------------------------------
** All indicators are lagging indicators.
Therefore, it is important to be aware that the indicator moves accordingly as price and volume move.
However, for the sake of convenience, we are talking in reverse for the interpretation of the indicator.
** The wRSI_SR indicator is an indicator created by adding settings and options to the existing Stochastic RSI indicator.
Therefore, the interpretation is the same as the traditional Stochastic RSI indicator. (K, D line -> R, S line)
** The OBV indicator was re-created by applying a formula to the DepthHouse Trading indicator, an indicator disclosed by oh92. (Thanks for this.)
** See support, resistance, and abbreviation points.
** Support or resistance is based on the closing price of the 1D chart.
** All descriptions are for reference only and do not guarantee a profit or loss in investment.
Explanation of abbreviations displayed in the chart
R: A point or section of resistance that requires a response to preserve profits.
S-L : Stop Loss point or section
S: A point or section where you can buy to make a profit as a support point or section.
(Short-term Stop Loss can be said to be a point where profit and loss can be preserved or additional entry can be made through split trading. It is a short-term investment perspective.)
GAP refers to the difference in prices that occurred when the stock market, CME, and BAKKT exchanges were closed because they are not traded 24 hours a day.
G1 : Closing price when closed
G2: Opening price
(Example) Gap (G1-G2)


MOOON!!!Let's GO!! Look at NEO and other cryptos that have already broken out.
EOS is primed and ready to fly.
(Not financial advice)

EOS/USD has broken the resistance at 4$With the increase of Bitcoin, EOS started pumping as well from the support 3$. Recently it has broken the resistance at 4$. Target 1 - 7$ ; Target 2 - 14$

