EOS 3D The whole life of the project on one chartOur previous idea-warning about a correction on EOSUSDT, although it was made on the daily timeframe, worked very quickly and t he EOS price fell even below the $ 5-5.5 zone , where we expected it.
By the way, this idea was included in our top 15 ideas for the last 2 months, where a possible future strong correction was clearly visible.
Since the daily time frame worked out quickly, today we will look at the entire history of trading in the EOSUSD pair on the 3D timeframe.
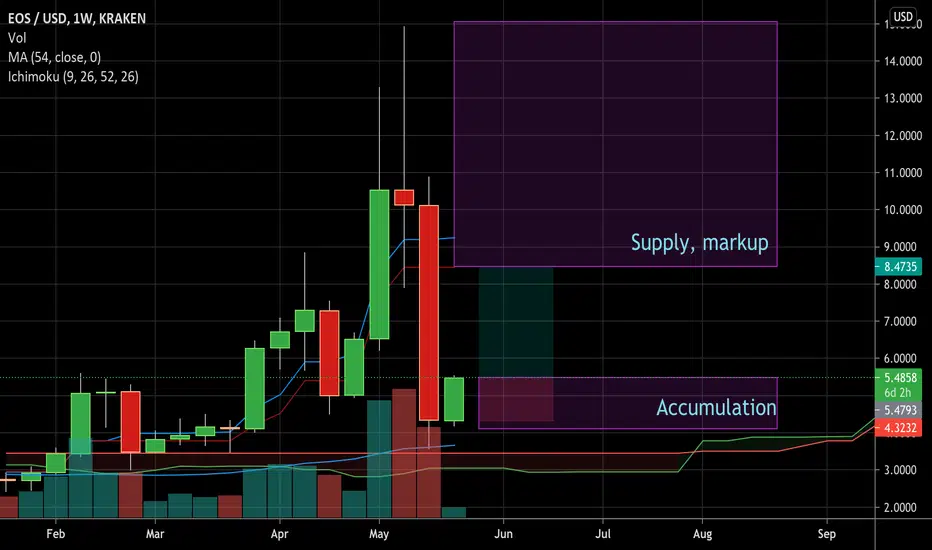
As you can see, the growth of the EOSUSD price on May 12 stopped perfectly in the middle of the global growth channel, along which the price has been moving for more than 3 years.
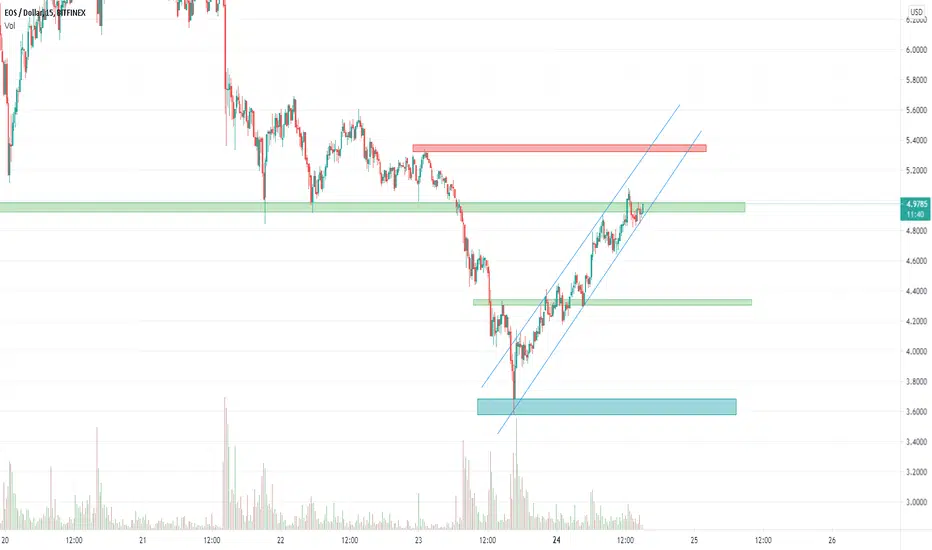
Then a strong fall down awaited us. The collapse in the market was powerful, and the price broke through even the strong mirror zone of $4.30-4.70 , which in history has more than once played the role of resistance or support.
However, buyers happily bought back EOS from $3.50 and above at a very tasty price, creating a Pinbar on the 3D timeframe. Buyers can regard this pattern as a strong signal to continue buying.
It turns out that the bravest and smartest investors who placed buckets for buying in the $3.50-5 zone will soon be able to fix x2-x3 profit , because the price of EOSUSDT has the potential to rise to the $8.70-9.20 zone
Further, a correction to the liquidity mirror zone of $4.30-4.70 may await us again, where again it will be decided who is stronger. Accordingly, it will become clear there: will buyers continue to drive the price by $13 or sellers will continue to push the price towards $3.
But this is a completely different story, which we will write about in new ideas)
_______________________________
Since 2016, we have been analyzing and trading the cryptocurrency market.
We transform our knowledge, trading moods and experience into ideas. Each "like under the idea" boosts the level of our happiness by 0.05%. If we help you to be calmer and richer - help us to be happier :)
EOSUSD.P trade ideas

EOS could to form a Shoulder Head Shoulder (inverted) toward $15There's an interesting trade that we can to keep until $15 USD. For that, EOS have all chances to go back to $15 USD. At the moment, I will going to be patient until EOS make a little down to $5.60 USD approximately. In case that EOS doesn't form this chartis pattern, we are going to look the level of $6.90 USD, this will be a resistance key to watch in the next hours.
s3.tradingview.com
In 3 Daily timerame, EOS continue in this ascending line that support in 4 occasion the bull trend. For that, trade or invest in EOS, will be a good decision. for my trade this cryptocurrency.
So, at the moment, I hope an entry at $5.60 USD and I look a down until $5.60 USD.


$EOS about to blow againInverse Head and shoulders with a td 9 sell in already with BTC this is about to go
T1: 6.80
T2: 8.50


EOS USDForming bull flag at 1 hour.
IfBTC holds its value then EOS will rise to 8 USD very very soon.DYOR. GOOD LUCK!


EOSUSD EOSCorrection movement seems to be over, Initial wave up "1" is over also, now "2" wave is being drawn, waiting for its finish and "3" wave initial rally up.


EOS USD buy for long and hodl it hhh
good luck guys ..
BUY AND THANK ME LATER DO YOUR ANALYSIS TOO
Please push **LIKE** to support idea , thanks
This post does not provide financial advice. It is for educational purposes only! You can use the information from the post to make your own trading plan for the market. But you must do your own research and use it as the priority. Trading is risky, and it is not suitable for everyone. Only you can be responsible for your trading.

EOS/Fiat Weekly OversoldPatience pays
Scalp to red line, then review
Daily has same fractal, weekly better setup
Blatant manipulation
r/r 2.59
Enjoy
EOS new ATHs incomingStrong possibility EOS test it's ATHs. I think it would be a wise decision to buy the retraces.

EOS 1.618 Hodling - Fib Circle Fibonacci circle for EOS
It can be seen that price is just sitting above 1.618
I expect price to stabilize above this area and break out bullishly
Also a Adam and Eve formation
Is in a good buy area right now
Allow the bottom to form

BEST Buying Opportunity!Everything is going according to plan like I said before.
Hit the support zone and have completed our bearish trend for now.
***I'm buying my cryptos RIGHT NOW because I don't think you'll get these cheap of prices again for a while or possibly ever again!!!
Look at previous pullbacks. All very hard, then we spike back up.
This pullback was just one of a larger degree/level so it over encompasses the last 3 upwaves. The pullback found support right in the area of wave 2 (right at the .786 level), which is typical of a 1st wave! That could indicated that we are going to be entering wave 3 very soon.
All I know is I don't have enough. I NEED MORE.
NOTE: IF we roll over and meaningfully break $3.50 that would be a sign that the bull trend is broken and that any upward movement is corrective in nature, only to be followed by another down move.
Not financial Advice.


Waiting for great growth It is in a multi-month support, if it can be supported, we expect good growth from it.

Eos (EOS) - May 22Hello?
Dear traders, nice to meet you.
By "following" you can always get new information quickly.
Please also click "Like".
Have a good day.
-------------------------------------
(EOSUSD 1W chart)
(1D chart)
We need to see if we can move above the 6.2573 point to break off the downtrend line.
If it falls, we need to get support at 5.1376 and see if it can move up along the uptrend line.
-------------------------------------
(EOSBTC 1W chart)
(1D chart)
1343 Satoshi-1574 Satoshi should be watched for any movements that deviate from it.
If it falls at 1343 Satoshi, Stop Loss is needed to preserve profit and loss.
However, it may rise along the uptrend line, so careful trading is necessary.
To get out of the downtrend line, we have to see if we can get support in the 1574 Satoshi-1690 Satoshi section.
--------------------------------------
It is advisable to trade at your average unit price.
This is because if the price flows below your average unit price, which was on an uptrend or downtrend, there is a high possibility that you will not be able to earn a large profit due to the psychological burden.
The center of every trade starts with the average unit price you start trading.
If you ignore this, you may be trading in the wrong direction.
Therefore, it is important to find a way to lower the average unit price and adjust the proportion of the investment, so that the money that ultimately corresponds to the profit can regenerate the profit.
-------------------------------------------------- -------------------------------------------
** All indicators are lagging indicators.
So, it's important to be aware that the indicator moves accordingly with the movement of price and volume.
Just for the sake of convenience, we are talking upside down for interpretation of the indicators.
** The wRSI_SR indicator is an indicator created by adding settings and options from the existing Stochastic RSI indicator.
Therefore, the interpretation is the same as the conventional stochastic RSI indicator. (K, D line -> R, S line)
** The OBV indicator was re-created by applying a formula to the DepthHouse Trading indicator, an indicator that oh92 disclosed. (Thank you for this.)
** Check support, resistance, and abbreviation points.
** Support or resistance is based on the closing price of the 1D chart.
** All explanations are for reference only and do not guarantee profit or loss on investment.
Explanation of abbreviations displayed on the chart
R: A point or section of resistance that requires a response to preserve profits
S-L: Stop Loss point or section
S: A point or segment that can be bought for profit generation as a support point or segment
(Short-term Stop Loss can be said to be a point where profits and losses can be preserved or additionally entered through installment transactions. It is a short-term investment perspective.
GAP refers to the difference in prices that occurred when the stock market or CME and BAKKT exchanges were closed because they are not trading 24 hours a day.
G1: Closing price when closed
G2: Cigar at the time of opening
(Example) Gap (G1-G2)


eos weekly chart long ideaThe market has corrected in a big way, checking for deeper, larger support areas. Where we once had resistance, we have now checked for support. These 2 areas are marked with blips on the chart. The arrows are showing how resistance has been flipped to support. If this is the new floor, lets take the stairs.
This is not financial advice. This is for my own reference and record as a hobby trader. This is purely for entertainment and educational purposes.
Don't be shy to comment. I would love to hear everyones opinion!

EOS/Dollar beginning for the long termWe just finished the "bloodbath" same as in 2017th we reached MA200, so from this button to the last top we will see in the market around 90-120% big green candles and as soon as it reaches this top it will be the beginning of the bear market.
BUT NOT IN EOS, if we check in the past when 2017th december the whole market did the same thing as it happend in this week EOS made a new ATH. If we check this Pitchfork we can see it's just the beginning. I'm not saying this gonna happen within a year but nothing is impossible. EOS might be 25 Dollar (middle of the Pitchfork) or even 50 Dollar (top side of the Pitchfork) in the long term.

EOSUSD Trade of the week!Trade Analysis based on Price Action...
With risk management you will never loss money
Thank you
Ridethemacro
