EOS/USDT – Double Bottom Formation Signals Potential 200% Upsidehi Traders
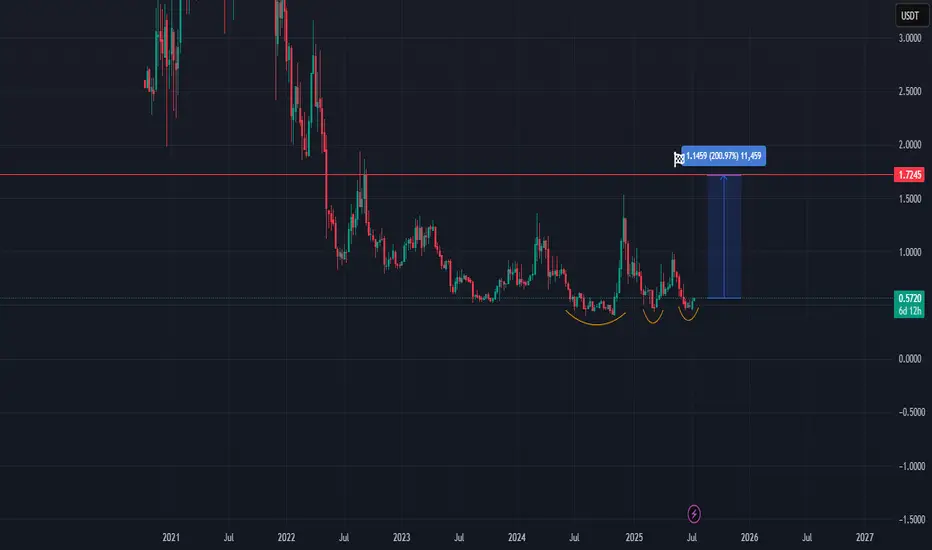
The EOS/USDT chart is currently showing a classic double bottom pattern, a strong bullish reversal signal typically seen after prolonged downtrends. This formation is evident with two distinct troughs forming near the $0.50–$0.55 range, followed by a recent price uptick indicating the start of a potential breakout.
The projected target for this breakout is around $1.72, which represents a 200% increase from the current level of approximately $0.57. This target aligns with a key horizontal resistance level from previous market structure.
If bullish momentum continues and volume supports the move, EOS could revisit this critical resistance zone in the coming weeks, making this a potential high-reward setup for traders eyeing a medium-term opportunity.
It may take some time but the patience will be rewarded!
EOSUSDT trade ideas
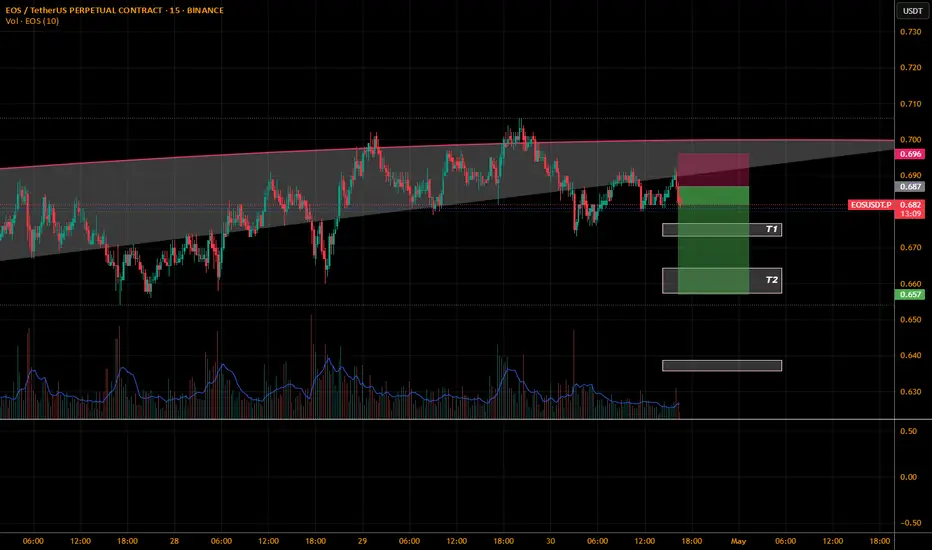
EOS 5X Lev. Full PREMIUM Trade-Numbers (PP: 1,070%)This is a very easy chart setup. It is also very strong. Without the trade-numbers and leverage the title was supposed to read as follows: "EOS, Easy 200% Bullish Wave."
I decided to go with leverage and the full numbers to trade. This is a winning trade. High probability chart setup. Cannot be missed.
Technical Analysis
» High volume, high volume and higher low.
» Strong green candle today.
» Bottom confirmed more than a month ago.
Full trade-numbers below:
_____
LONG EOSUSDT
Leverage: 5X
Entry levels:
1) 0.6450
2) 0.5900
Targets:
1) 0.6631
2) 0.7340
3) 0.8048
4) 0.9058
5) 1.0343
6) 1.1761
7) 1.2638
8) 1.4055
9) 1.6350
10) 1.7684
11) 2.0062
Stop-loss:
Close weekly below 0.5800
Potential profits: 1070%
Capital allocation: 5%
_____
If you enjoy the content, consider hitting follow.
Always leave a comment and boost, this is the way you show your support. It is free and will only take one minute of your time. Win-win-win.
I am wishing for you the greatest profits and success.
You can do good. We will win in this bull market. We will recover all losses and end with big gains.
—Financial success can be achieved.
—Patience is key.
—Cryptocurrency is easy.
—We are here to win.
Namaste.

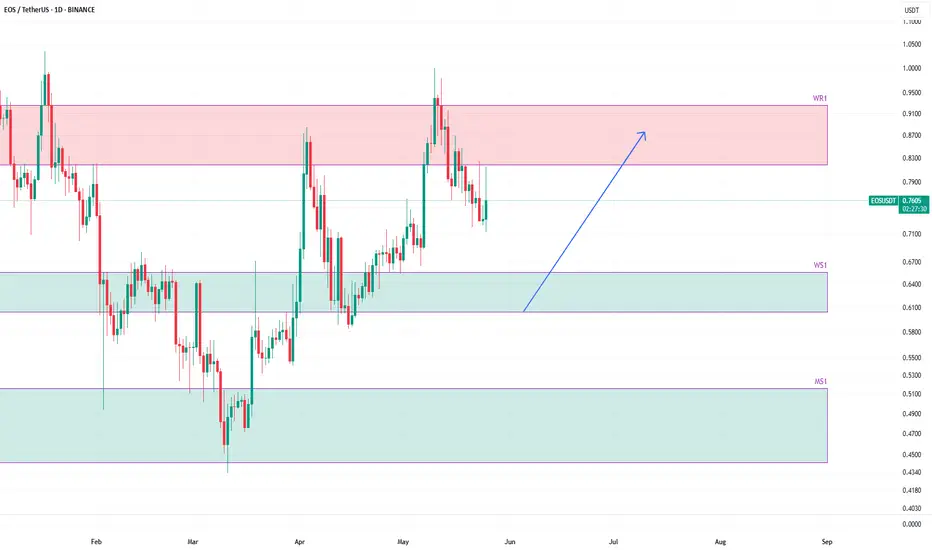
EOSUSDT to bounce from weekly support on dropEOSUSDT is currently trending down after hitting weekly resistance WR1.
The next support is weekly support WS1. This is a logical zone from where the price is likely to bounce. This bounce will have first traget as WR1.
In case the price, anytime breaks WS1 zone, the next support is monthly support MS1. This is a quite strong support area and a long from here would be a good trade since the probability that the price will hold and bounce from there will be very high.
Eos (EOS): Possible Movement To Lower Side of Bollinger BandsEOS coin might see a good downward movement after we had a liquidity grab that led the price outside the Bollinger Bands and resulted in a quick movement back to EMAs.
We are keeping our attention now on those EMAs, as this is the spot that might start a proper downward movement - so let's wait for a breakdown after what we most probably will move to the lower side of BB.
Swallow Academy

EOS Broke Out From A Solid Triangle PatternEOS Broke Out From A Solid Triangle Pattern
EOS confirmed a triangle pattern, suggesting potential bullish movement.
The price is currently at 0.800 and looks poised for the target levels at 0.8870, 0.9660, and 1.0770.
After BTC growth, it's time for Altcoins to make their move.
The price has broken the consolidation phase, indicating possible upward momentum.
Looks like this breakout is accompanied by strong volume, which gains credibility to the pattern.
The levels marked reflect potential resistance areas where price action could react
PS: A close below the triangle could invalidate the bullish setup.
You may find more details in the chart!
Thank you and Good Luck!
❤️PS: Please support with a like or comment if you find this analysis useful for your trading day❤️

Be careful with EOS !!!The EOS will increase 30 cents and reach to the top of the wedge in the coming weeks .
Give me some energy !!
✨We spend hours finding potential opportunities and writing useful ideas, we would be happy if you support us.
Best regards CobraVanguard.💚

Buy setup for EOSUSDT Based on the current EOS/USDT chart, the price appears to be undergoing a pullback. It seems to be testing a key horizontal level, potentially a support zone, for the second time. This retest of the level could be seen by some traders as a potential entry point.

EOSUSDT – Hidden OpportunityEOSUSDT – This chart may not scream opportunity at first glance, but those who have been in the markets long enough know: the biggest profits often come from the setups others ignore. Right now, the blue box zones are key levels of interest, areas where value quietly builds before the market moves.
We’re not just randomly drawing boxes. These are regions backed by liquidity data, orderflow patterns, and historical buyer behavior. EOS has shown a tendency to bounce from these zones, especially when broader market sentiment is uncertain. If we see confirmation on low timeframes, such as reclaiming the zone with solid volume and candle structure, a long trade can be considered.
But as always, I never insist on my long ideas without conditions. If price breaks downward and fails to reclaim on smaller timeframes, I simply stay away. No ego, just discipline.
It’s also crucial to highlight this: this analysis is not based on hype but on proven price action and volume behaviors. That’s why people keep coming back. These insights are not widely known, and most traders act on emotion, not structure.
📌 If you’ve been searching for clarity, this is it. Blue box areas = value zones. Act with confirmation. Protect your capital, but don’t be afraid to move when the setup is right.
📌I keep my charts clean and simple because I believe clarity leads to better decisions.
📌My approach is built on years of experience and a solid track record. I don’t claim to know it all but I’m confident in my ability to spot high-probability setups.
📌If you would like to learn how to use the heatmap, cumulative volume delta and volume footprint techniques that I use below to determine very accurate demand regions, you can send me a private message. I help anyone who wants it completely free of charge.
🔑I have a long list of my proven technique below:
🎯 ZENUSDT.P: Patience & Profitability | %230 Reaction from the Sniper Entry
🐶 DOGEUSDT.P: Next Move
🎨 RENDERUSDT.P: Opportunity of the Month
💎 ETHUSDT.P: Where to Retrace
🟢 BNBUSDT.P: Potential Surge
📊 BTC Dominance: Reaction Zone
🌊 WAVESUSDT.P: Demand Zone Potential
🟣 UNIUSDT.P: Long-Term Trade
🔵 XRPUSDT.P: Entry Zones
🔗 LINKUSDT.P: Follow The River
📈 BTCUSDT.P: Two Key Demand Zones
🟩 POLUSDT: Bullish Momentum
🌟 PENDLEUSDT.P: Where Opportunity Meets Precision
🔥 BTCUSDT.P: Liquidation of Highly Leveraged Longs
🌊 SOLUSDT.P: SOL's Dip - Your Opportunity
🐸 1000PEPEUSDT.P: Prime Bounce Zone Unlocked
🚀 ETHUSDT.P: Set to Explode - Don't Miss This Game Changer
🤖 IQUSDT: Smart Plan
⚡️ PONDUSDT: A Trade Not Taken Is Better Than a Losing One
💼 STMXUSDT: 2 Buying Areas
🐢 TURBOUSDT: Buy Zones and Buyer Presence
🌍 ICPUSDT.P: Massive Upside Potential | Check the Trade Update For Seeing Results
🟠 IDEXUSDT: Spot Buy Area | %26 Profit if You Trade with MSB
📌 USUALUSDT: Buyers Are Active + %70 Profit in Total
🌟 FORTHUSDT: Sniper Entry +%26 Reaction
🐳 QKCUSDT: Sniper Entry +%57 Reaction
📊 BTC.D: Retest of Key Area Highly Likely
📊 XNOUSDT %80 Reaction with a Simple Blue Box!
📊 BELUSDT Amazing %120 Reaction!
📊 Simple Red Box, Extraordinary Results
I stopped adding to the list because it's kinda tiring to add 5-10 charts in every move but you can check my profile and see that it goes on..

EOSUSDT LONG PositionA good opportunity for holders and investors of this currency
On the 4-hour time frame, it is in a support area and a positive hidden divergence has formed. You can enter a step and be in the upward trend to the set targets.

EOSUSDT 1D Analysis EOS ~ 1D Analysis
#EOS Buy on retesting this support block with a short term target of at least 10%++

EOS Update: New 2025 All-Time High & MoreWe've been looking at the daily timeframe for EOS and the daily timeframe is mostly short-term. This is because we were focused on a leveraged trade setup. But, now that the bullish bias has been confirmed—notice how big is this weekly session—we can consider the bigger picture.
Here is EOSUSDT still moving within the long-term consolidation channel that appeared after the 2022 bear market. Immediately we can extract some positives out of this information, it is still early.
While EOS has been growing now for two months straight, since March 10, the action is still happening below the early December 2024 high. This high is part of a long-term consolidation channel.
As the action turns bullish and a recovery develops, EOS will finally enter the bullish zone. The bullish zone activates higher prices and these higher prices will lead to the 2025 bull run ending in a new All-Time High.
The targets are divided in two sessions, the local targets ending around $5.50 and the "global" targets which show $9.50 as a strong level, $11.8 and also $23.6 as a new All-Time High potential. This is only a potential because I haven't given much thoughts to these numbers. My strategy is to keep it clean and simple. Get the bottom—buy when prices are low—wait patiently and let the market grow.
Just as the market showed us with clear and strong signals when the bottom was in, it will also reveal when the top is in. We just buy and hold and when prices are up, we enjoy the profits and consider selling when the action is near a top. Not the perfect top, but near the top because it is hard to know how far up a Cryptocurrency can really go.
When the last wave comes, the market becomes euphoric and everything gets out of control. A rise to $23 can lead to $34, $55, $80 or even more because the last wave is the speculative phase, anything goes.
I hope you enjoy the content.
It is still early.
Thanks a lot for your continued support.
Namaste.

EOS/USDT Analysis: Long Setup
This coin is showing a steady bullish trend. Two strong volume zones have formed during the rally: $0.83–$0.81 and $0.785–$0.77.
We’re considering a continuation of the current move if there’s a bullish reaction from those levels.
The primary target is $0.90.
This publication is not financial advice.

The key is whether it can be supported and rise near 0.8033
Hello, traders.
If you "Follow", you can always get new information quickly.
Please click "Boost" as well.
Have a nice day today.
-------------------------------------
(EOSUSDT 1D chart)
The 0.8033 point is the HA-High indicator point on the 1W chart.
The M-Signal indicator on the 1M chart is passing near this point.
Accordingly, the key is whether it can be supported and rise near 0.8033.
If the price is maintained above the M-Signal indicator on the 1M chart, it is highly likely that the upward trend will continue in the medium to long term.
-
I think the 0.8033 point is a possible point for a breakout trade.
The next possible point for a breakout trade is the 1.3193 point.
-
If it is supported and rises near 0.8033, you should respond depending on whether there is support near 1.0044-1.100.
-
If it falls from the 0.8033 point,
1st: 0.6678-0.6920
2nd: 0.5255-0.5820
You should check whether there is support near the 1st and 2nd points above.
-
Thank you for reading to the end.
I hope you have a successful trade.
--------------------------------------------------
- This is an explanation of the big picture.
I used TradingView's INDEX chart to check the entire range of BTC.
I rewrote the previous chart to update it by touching the Fibonacci ratio range of 1.902 (101875.70) ~ 2 (106275.10).
(Previous BTCUSD 12M chart)
Looking at the big picture, it seems to have been following a pattern since 2015 and has been rising.
In other words, it is a pattern that maintains a 3-year uptrend and faces a 1-year downtrend.
Accordingly, the uptrend is expected to continue until 2025.
-
(Current BTCUSD 12M chart)
Based on the currently written Fibonacci ratio, it shows up to 3.618 (178910.15).
Fibonacci ratio 0.618 (44234.54) is not expected to fall again.
(BTCUSDT 12M chart)
I think it is around 42283.58 when looking at the BTCUSDT chart.
-
I will explain it again with the BTCUSD chart.
The Fibonacci ratio ranges marked in the light green boxes, 1.902 (101875.70) ~ 2 (106275.10) and 3 (151166.97) ~ 3.14 (157451.83), are expected to be important support and resistance ranges.
In other words, it seems likely to act as a volume profile range.
Therefore, in order to break through this section upward, I think the point to watch is whether it can rise with support near the Fibonacci ratios of 1.618 (89126.41) and 2.618 (134018.28).
Therefore, the maximum rising section in 2025 is expected to be the 3 (151166.97) ~ 3.14 (157451.83) section.
To do that, we need to look at whether it can rise with support near 2.618 (134018.28).
If it falls after the bull market in 2025, we don't know how far it will fall, but considering the previous decline, we expect it to fall by about -60% to -70%.
So, if the decline starts near the Fibonacci ratio 3.14 (157451.83), it seems likely that it will fall to around Fibonacci 0.618 (44234.54).
I will explain more details when the downtrend starts.
------------------------------------------------------

Eos scalp long to $0.7294Just now entered a long position on EOS. Expecting continuation push towards $0.7294 rea.
Time sensitive
Stop: $0.7103 or lower
Roughly 2RR

EOS Update: 2025 Bull Market ConfirmedYesterday EOS produced a high volume candle, the first one since mid-April.
The conditions for this pair are really good and everything is happening according to bull market dynamics.
Notice the developing of a broad rising channel. Also notice the fact that after the major low in early March there is no rush for the market to grow, instead, we are seeing slow and steady growth. This is a type of consolidation which I call bullish consolidation, instead of sideways prices accumulate but slowly moving higher.
The other reason why there is no hurry for the market to grow is because we are now in a bull market. Since there is going to months and months of bullish action, the bulls can take their time and this is what is happening.
The path is clear and the bullish bias is 100% confirmed. It is reinforced with each passing day that closes green. Patience is key.
In late 2024 the bullish wave lasted exactly one month, between 4-November and 4-December, this time, the bullish wave can last 6 months or more from bottom to top. When the bullish wave is over the action will go off this chart.
Prepare for positive surprises.
Prepare for huge profits.
Do whatever you have to do to be prepared.
Do not be caught off guard, it will be big and the market will give you as much as you can handle.
Thanks a lot for your continued support.
Namaste.

EOS TRADE IDEAEOAUSDTP has done breakout and bullish BOS, I am looking for long and my entry area is marked as POI where is FVG and breaker block as well.

EOSUSDT is bullish in 1h time frameEOSUSDT is bullish in 1h time frame as it printed bullish engulfing candle at HL

EOS will go for a liquidity hunt!EOS is leaving a huge liquidity trail behind. Just look at the 4 hr higher low wicks. All these wicks are just representing stop losses.
The pwProfile (previous week profile) is showing us short-covering. Aggressive short-term buyers are competing against long-term sellers who will target all the lower liquidity at some point.
I took a small short already here above the pwVAH (previous week value area high). I might add at the FTR draw (if it will get hit) and I am even open minded for a surprising run to the upper pwVAH.
Hard to tell if it will break down from here or if it will go higher first to generate some more liquidty. Overall I am prepared for downside and I want to see the lower pmPOC (previous month point of control). This level is my main target.

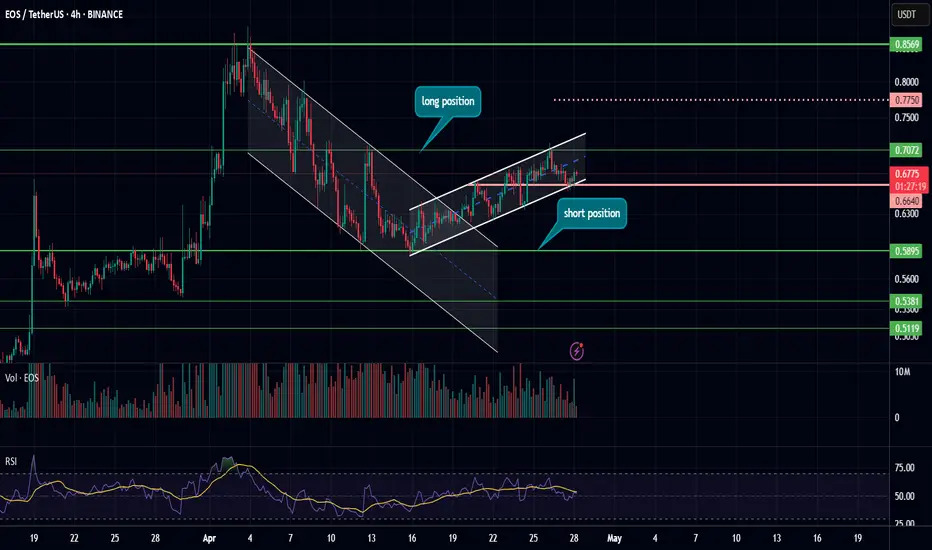
AMKTcryptomarket | Additional EOS review tipsHello to all AMKT members.😍
After analyzing the EOS token, we entered a new structure that we will analyze together.
In the 4-hour timeframe, after exiting the downward channel, we entered the ascending channel, which has created a bottom in the 0.6640 range.
For the long position, our trigger is still the 0.7072 break, and we must keep in mind that since we entered the ascending channel, there is a possibility that the 0.7750 range will be a resistance for us, but our target is still 0.8869.
But for the short position, our trigger is 0.5895 with increasing volume, but if we want to go for a short position, we can enter a short position by risking our capital with a break of 0.6640, which is a risky position.
#EOS/USDT#EOS
The price is moving within a descending channel on the 1-hour frame and is expected to continue lower.
We have a trend to stabilize below the 100 moving average once again.
We have a downtrend on the RSI indicator, supporting the upward move with a breakout.
We have a resistance area at the upper limit of the channel at 0.6118.
Entry price: 0.6046
First target: 0.5921
Second target: 0.5710
Third target: 0.5480

Analysis of EOS CoinHello to all members of the AMKT crypto channel. In our first analysis in the TradingView space, we are going to look at the EOS coin together.😍
On the monthly time frame, we are in a downtrend where we were supported by our last monthly support level and were able to create a higher low and are waiting for a higher high.
We are also in a downtrend on the weekly time frame.
In the daily timeframe, we are forming a range structure between 0.5895 and 0.8789, and we can take a position by exiting from either side and increasing volume.
And on the 4-hour time frame, we are in a descending channel that generally creates a boxed range between 0.5895 and 0.7072. For long positions, after breaking 0.7072, we can take a long position and wait for a break of 0.8789, but for short position, we should wait for an increase in volume, because the volume is decreasing and if the volume increases, we can enter a short position with a break of 0.5895.
Have a good day with lots of profits.😍

TradeCityPro | EOS Retraces Gains: Key Levels to Watch Now👋 Welcome to TradeCity Pro!
In this analysis, I’m going to review the EOS coin for you. This is one of the American-based projects operating in the Web3 space, currently ranked 63 on CoinMarketCap with a market cap of $970 million.
⌛️ 4-Hour Timeframe
On the 4-hour timeframe, as you can see, the price formed a bullish move after breaking through the 0.5997 level, which continued up to the 0.8604 zone before entering a correction phase.
🔍 After being rejected from the 0.8604 top, the price experienced a significant decline and has now returned to the 0.5997 level, fully retracing all of its previous bullish waves.
📈 For a long position, you can enter on a breakout above 0.6338. If the price stabilizes above this zone, it could move upward toward the 0.8064 level.
🔽 For a short position, you can enter if 0.5997 is broken, and the next bearish leg could potentially extend to 0.5433.
📝 Final Thoughts
This analysis reflects our opinions and is not financial advice.
Share your thoughts in the comments, and don’t forget to share this analysis with your friends! ❤️
