#EOS/USDT#EOS
The price is moving within a descending channel on the 1-hour frame and is expected to continue lower.
We have a trend to stabilize below the 100 moving average once again.
We have a downtrend on the RSI indicator, supporting the upward move with a breakout.
We have a resistance area at the upper limit of the channel at 0.6118.
Entry price: 0.6046
First target: 0.5921
Second target: 0.5710
Third target: 0.5480
EOSUSDT trade ideas

EOS will go for a liquidity hunt!EOS is leaving a huge liquidity trail behind. Just look at the 4 hr higher low wicks. All these wicks are just representing stop losses.
The pwProfile (previous week profile) is showing us short-covering. Aggressive short-term buyers are competing against long-term sellers who will target all the lower liquidity at some point.
I took a small short already here above the pwVAH (previous week value area high). I might add at the FTR draw (if it will get hit) and I am even open minded for a surprising run to the upper pwVAH.
Hard to tell if it will break down from here or if it will go higher first to generate some more liquidty. Overall I am prepared for downside and I want to see the lower pmPOC (previous month point of control). This level is my main target.

AMKTcryptomarket | Additional EOS review tipsHello to all AMKT members.😍
After analyzing the EOS token, we entered a new structure that we will analyze together.
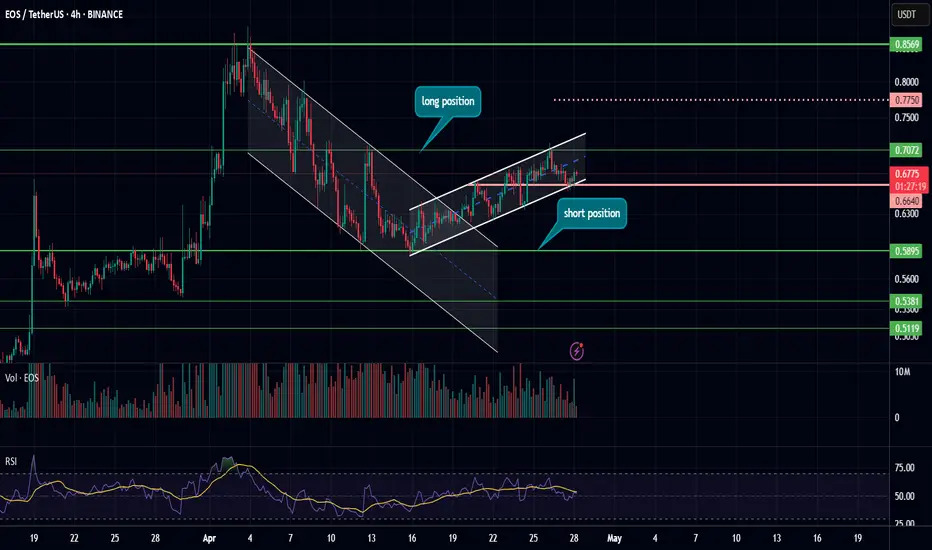
In the 4-hour timeframe, after exiting the downward channel, we entered the ascending channel, which has created a bottom in the 0.6640 range.
For the long position, our trigger is still the 0.7072 break, and we must keep in mind that since we entered the ascending channel, there is a possibility that the 0.7750 range will be a resistance for us, but our target is still 0.8869.
But for the short position, our trigger is 0.5895 with increasing volume, but if we want to go for a short position, we can enter a short position by risking our capital with a break of 0.6640, which is a risky position.
TradeCityPro | EOS Retraces Gains: Key Levels to Watch Now👋 Welcome to TradeCity Pro!
In this analysis, I’m going to review the EOS coin for you. This is one of the American-based projects operating in the Web3 space, currently ranked 63 on CoinMarketCap with a market cap of $970 million.
⌛️ 4-Hour Timeframe
On the 4-hour timeframe, as you can see, the price formed a bullish move after breaking through the 0.5997 level, which continued up to the 0.8604 zone before entering a correction phase.
🔍 After being rejected from the 0.8604 top, the price experienced a significant decline and has now returned to the 0.5997 level, fully retracing all of its previous bullish waves.
📈 For a long position, you can enter on a breakout above 0.6338. If the price stabilizes above this zone, it could move upward toward the 0.8064 level.
🔽 For a short position, you can enter if 0.5997 is broken, and the next bearish leg could potentially extend to 0.5433.
📝 Final Thoughts
This analysis reflects our opinions and is not financial advice.
Share your thoughts in the comments, and don’t forget to share this analysis with your friends! ❤️

EOS 5X Lev. Full PREMIUM Trade-Numbers (PP: 1,070%)This is a very easy chart setup. It is also very strong. Without the trade-numbers and leverage the title was supposed to read as follows: "EOS, Easy 200% Bullish Wave."
I decided to go with leverage and the full numbers to trade. This is a winning trade. High probability chart setup. Cannot be missed.
Technical Analysis
» High volume, high volume and higher low.
» Strong green candle today.
» Bottom confirmed more than a month ago.
Full trade-numbers below:
_____
LONG EOSUSDT
Leverage: 5X
Entry levels:
1) 0.6450
2) 0.5900
Targets:
1) 0.6631
2) 0.7340
3) 0.8048
4) 0.9058
5) 1.0343
6) 1.1761
7) 1.2638
8) 1.4055
9) 1.6350
10) 1.7684
11) 2.0062
Stop-loss:
Close weekly below 0.5800
Potential profits: 1070%
Capital allocation: 5%
_____
If you enjoy the content, consider hitting follow.
Always leave a comment and boost, this is the way you show your support. It is free and will only take one minute of your time. Win-win-win.
I am wishing for you the greatest profits and success.
You can do good. We will win in this bull market. We will recover all losses and end with big gains.
—Financial success can be achieved.
—Patience is key.
—Cryptocurrency is easy.
—We are here to win.
Namaste.

Analysis of EOS CoinHello to all members of the AMKT crypto channel. In our first analysis in the TradingView space, we are going to look at the EOS coin together.😍
On the monthly time frame, we are in a downtrend where we were supported by our last monthly support level and were able to create a higher low and are waiting for a higher high.
We are also in a downtrend on the weekly time frame.
In the daily timeframe, we are forming a range structure between 0.5895 and 0.8789, and we can take a position by exiting from either side and increasing volume.
And on the 4-hour time frame, we are in a descending channel that generally creates a boxed range between 0.5895 and 0.7072. For long positions, after breaking 0.7072, we can take a long position and wait for a break of 0.8789, but for short position, we should wait for an increase in volume, because the volume is decreasing and if the volume increases, we can enter a short position with a break of 0.5895.
Have a good day with lots of profits.😍

EOS TRADE IDEAEOAUSDTP has done breakout and bullish BOS, I am looking for long and my entry area is marked as POI where is FVG and breaker block as well.

EOSUSDT is bullish in 1h time frameEOSUSDT is bullish in 1h time frame as it printed bullish engulfing candle at HL

eos buy midterm"🌟 Welcome to Golden Candle! 🌟
We're a team of 📈 passionate traders 📉 who love sharing our 🔍 technical analysis insights 🔎 with the TradingView community. 🌎
Our goal is to provide 💡 valuable perspectives 💡 on market trends and patterns, but 🚫 please note that our analyses are not intended as buy or sell recommendations. 🚫
Instead, they reflect our own 💭 personal attitudes and thoughts. 💭
Follow along and 📚 learn 📚 from our analyses! 📊💡"

EOS/USDT – Potential Bounce from FIB Zone
📉 Trend Structure:
Price was in a downtrend within a falling wedge structure.
A breakout has occurred, followed by a retest of the wedge and price currently moving toward a buy zone aligned with Fibonacci retracement levels.
📊 FIB Buy Zone:
Strong support area located between the 0.618 and 0.786 Fibonacci levels.
This zone is highlighted as a potential long entry area on a pullback.
🎯 Potential Bullish Targets:
TP1: $0.9722
TP2: $1.1130
TP3: $1.2819
🛡 Stop Loss Idea: Below the lower edge of the wedge pattern (~$0.55 or lower), depending on risk tolerance.
EOS has broken out of a key falling wedge pattern, a typically bullish formation. A pullback into the FIBO buy zone could present a great opportunity for a long entry before continuation to higher levels. The structure suggests a potential wave continuation toward $1.28 and beyond.

EOS 4H Wedge Pair: EOSUSDT
Timeframe: 4h
Pattern: Falling Wedge 🟢
If look chart 4h and make lines can see Falling Wedge. Of course this is scenario will working if we breakout up
Target 0.62$/ 0.685$

EOSUSDT – Attempting a Macro Reversal?Join our community and start your crypto journey today for:
In-depth market analysis
Accurate trade setups
Early access to trending altcoins
Life-changing profit potential
Let' analyse EOSUSDT:
EOS has been in a long-term downtrend, consistently forming lower highs and lower lows. However, the recent price action shows signs of potential macro reversal, especially after breaking out above the multi-year descending trendline.
The price has respected the strong support zone multiple times and recently formed a Higher Low (HL) after bouncing from this region. This HL came after a Higher High (HH) earlier in 2025, hinting at a possible trend shift from bearish to bullish.
That said, the price is still trading below a key breakout resistance zone, which previously acted as a major supply area. A weekly close above this level is critical to validate a long-term trend reversal.
If EOS manages to reclaim this breakout zone and push toward $1.30 and beyond, the next major targets are $2.43 and $3.74, respectively. However, rejection from this zone may lead to further consolidation or even a revisit of the support.
Key Levels to Watch:
* Resistance: $1.30 (Breakout Zone), $2.4373, $3.7480
* Support: $0.43–$0.35 zone
* Structure: HH > HL already formed, confirmation awaited
If you find this analysis helpful, please hit the like button to support my content! Share your thoughts in the comments, and feel free to request any specific chart analysis you’d like to see.
Happy Trading!!

EOSUSDTEOS/USD Bearish Continuation Setup – 800 EMA Rejection with Structural Confluence
📍 Entry Type: Swing Trade (H4 Chart)
🔻 Position: Short
🛑 Stop Loss: 0.7280 (Above 800 EMA & last impulse high)
🎯 Take Profit: 0.4250 (Prior SAR zone + structure intersection)
⚖️ R:R Ratio: ~3.5:1
📉 Technical Breakdown:
Price has cleanly rejected the 800 EMA (black) and is now below both the 55 SMA (red) and 200 EMA (green).
The 55 SMA slope has flipped downward — your system’s primary signal for trend confirmation.
Bear Power (100) remains negative, reinforcing downside pressure and momentum.
Williams %R (50 & 100) just broke below the -80 line again, signaling renewed bearish intent after a brief overbought condition.
Parabolic SAR remains firmly above the price, tracking the downtrend.
The price is also hovering under a key horizontal resistance level (previous support flip), adding structure-based confluence.
⚠️ Risk Management:
Stop is set just above the 800 EMA to account for institutional stop runs or spike traps. TP is aligned with historical structure, a former SAR shift, and psychological round-number support near 0.4250.

#EOS/USDT#EOS
The price is moving within a descending channel on the 1-hour frame, adhering well to it, and is heading for a strong breakout and retest.
We are seeing a rebound from the lower boundary of the descending channel, which is support at 0.6321.
We have a downtrend on the RSI indicator that is about to be broken and retested, supporting the upward trend.
We are looking for stability above the 100 Moving Average.
Entry price: 0.6321
First target: 0.6620
Second target: 0.6931
Third target: 0.7294

Eos (EOS): Possible Movement To Lower Side of Bollinger BandsEOS coin might see a good downward movement after we had a liquidity grab that led the price outside the Bollinger Bands and resulted in a quick movement back to EMAs.
We are keeping our attention now on those EMAs, as this is the spot that might start a proper downward movement - so let's wait for a breakdown after what we most probably will move to the lower side of BB.
Swallow Academy

Important support and resistance zone: 0.6678-0.8033
Hello, traders.
If you "Follow", you can always get new information quickly.
Please click "Boost" as well.
Have a nice day today.
-------------------------------------
(EOSUSDT 1M chart)
In order to continue the uptrend, it must rise above the M-Signal indicator on the 1M chart.
Currently, the HA-Low indicator on the 1M chart is formed at the 2.8769 point, so if the HA-Low indicator is not newly created, it will rise to around 2.8769 and show support, which is the time to buy.
However, since it is far from the M-Signal indicator of the 1M chart, it is important to check whether the price is maintained above the M-Signal indicator of the 1M chart for now.
-
(1D chart)
The 0.6678-0.8033 section is an important support and resistance section.
Therefore, the key is whether it can be supported and rise near this section.
If it falls, you should check whether it is supported near 0.5255-0.5820.
If it starts to rise, it is likely to rise to the HA-Low indicator of the 1M chart.
-
Thank you for reading to the end.
I hope you have a successful trade.
--------------------------------------------------
- This is an explanation of the big picture.
I used TradingView's INDEX chart to check the entire section of BTC.
I rewrote the previous chart to update it by touching the Fibonacci ratio range of 1.902 (101875.70) ~ 2 (106275.10).
(Previous BTCUSD 12M chart)
Looking at the big picture, it seems to have been following a pattern since 2015 and has been rising.
In other words, it is a pattern that maintains a 3-year uptrend and faces a 1-year downtrend.
Accordingly, the uptrend is expected to continue until 2025.
-
(Current BTCUSD 12M chart)
Based on the currently written Fibonacci ratio, it shows up to 3.618 (178910.15).
Fibonacci ratio 0.618 (44234.54) is not expected to fall again.
(BTCUSDT 12M chart)
I think it is around 42283.58 when looking at the BTCUSDT chart.
-
I will explain it again with the BTCUSD chart.
The Fibonacci ratio ranges marked in the light green boxes, 1.902 (101875.70) ~ 2 (106275.10) and 3 (151166.97) ~ 3.14 (157451.83), are expected to be important support and resistance ranges.
In other words, it seems likely to act as a volume profile range.
Therefore, in order to break through this section upward, I think the point to watch is whether it can rise with support near the Fibonacci ratios of 1.618 (89126.41) and 2.618 (134018.28).
Therefore, the maximum rising section in 2025 is expected to be the 3 (151166.97) ~ 3.14 (157451.83) section.
To do that, we need to look at whether it can rise with support near 2.618 (134018.28).
If it falls after the bull market in 2025, we don't know how far it will fall, but considering the previous decline, we expect it to fall by about -60% to -70%.
Therefore, if the decline starts near the Fibonacci ratio 3.14 (157451.83), it seems likely that it will fall to around Fibonacci 0.618 (44234.54).
I will explain the details again when the downtrend begins.
------------------------------------------------------

EOSUSDT → False Breakeout of resistance (counter-trend )BINANCE:EOSUSDT.P within the consolidation distribution 0.54 - 0.6 reaches the key resistance and forms a false breakdown without the possibility of continued growth.
The cryptocurrency market is showing weakness, especially after yesterday's Trump speech and the approval of new Tariffs, which creates risks and pressure on the cryptocurrency market. Bitcoin is back in the red zone after rallying, while altcoins will continue to look for a new bottom. EOS stands out in this list, which strengthened quite strongly and the purpose of this maneuver was countertrend accumulation and liquidity capture relative to the range of 0.7 - 0.8. The distribution is tempered by a false breakout of the level 0.82 - 0.86
Resistance levels: 0.82, 0.86
Support levels: 0.793, 0.666
If the bears hold the resistance 0.82 - 0.86 and the consolidation under the level will end with the breakout of the trigger 0.793 and price consolidation in the selling zone, it may provoke a reversal and fall to the zones of interest: fvg, 0.64, 0.541.
Regards R. Linda!

#EOSUSDTIn my opinion, these targets will be touched soon.
And it seems the whales of this coin are they are slowly leaving from this coin
In a market where all coins are falling and this coin grew so much in one day, the only reason for that was market makers and whales of this coin, not the good fundamental of this coin.
This coin is not worth investing in from a fundamental point of view.

Will EOSUSDT Retrace 12%EOSUSDT has done quite well vs other far more accepted or adopted coins (see ETHUSDT price), but that is from an opinion or fundamental speculative side. I think se are more likely than not to see a 50% retrace from it's rise in price that began on the 11th of March. I have a hypothesis that we have not seen the true lows and as people are getting long, we are generally seeing the next leg down and ether causing longs to have to cove or be liquidated on many tokens. Of course we could pause right here and continue up in price. But this is my bias, and that is to do the opposite and we will see who has to cover first. haha. As usual I will be ready with staggered extra shorts to average up my entry if we suddenly rise in price instead and look for an exit if wrong. Enjoy!

LIMIT ORDER - #EOS/USDTLIMIT ORDER - $EOS/USDT
Direction: #Short 🔴
Entry Price: 0.766
Stop Loss: 0.85406
Target 1: 0.70734
Target 2: 0.64868
Target 3: 0.59002
Target 4: 0.53137
Target 5: 0.47271

EOS price analysis⁉️ Do you know which asset has been growing instead of falling for 3 weeks now?)
Yes, it's #EOS
You will say that its price simply has nowhere to fall, and you will probably be right again!)
Although it is still very far from 0, it was once the largest ICO in 2017, if memory serves, it raised $4 billion.
8 years have passed and #EOS capitalization does not even reach $1 billion.
In general, the price of OKX:EOSUSDT moves quite well between levels, so you can use them from the chart for your trading.
Or just continue to wait patiently for the #EOSUSD price to reach $0.70, $1, or even $1.40 again.
🤑 But with even the most optimistic forecasts, we have very little faith that the price of #EOS will reach more than $6 in this growth cycle.
_____________________
Did you like our analysis? Leave a comment, like, and follow to get more

EOS/USDT – LONG Setup
✅ Entry Zone: $0.70 – $0.78
🎯 Targets:
• T1: $1.12
• T2: $1.64
🔻 Stop Loss: $0.62
🔍 Technical Insight:
EOS has broken out of a descending wedge pattern and successfully reclaimed a major support-turned-resistance zone. The bullish engulfing candle on the weekly timeframe confirms momentum shift. If price sustains above the breakout zone, we may see a strong continuation toward the next resistance levels.
📌 Strategy:
Look for a retest of the breakout zone ($0.70–$0.78) and confirmation of support to initiate long positions. Aiming for mid-term targets as momentum builds.
