EOSUSDT trade ideas

EOSUSDT Elliott Waves AnalysisHello friends.
Please support my work by clicking the LIKE button👍(If you liked). Also i will appreciate for ur activity. Thank you!
Everything on the chart.
my previous analysis where I was marking the impulse was invalidated and we reshaped the structure into the ending diagonal.
Entry: 0.75 - 0.6
Targets: 1 - 1.3 - 1.8 - 2.2
after first target reached move ur stop to breakeven
Stop: (depending of ur risk). ALWAYS follow ur RM .
risk is justified
Good luck everyone!
Follow me on TRADINGView, if you don't want to miss my next analysis or signals.
It's not financial advice.
Dont Forget, always make your own research before to trade my ideas!
Open to any questions and suggestions.

EOSUSDTRisk warning, disclaimer: the above is a personal market judgment based on published information and historical chart data on Tradingview, all analysis is only subjective. Hope investors consider, that I am not responsible for your investment decision.
Thank you.
Good luck

EOS Breaks August Downtrend (Can Grow 60%)The downtrend that started for EOSUSDT with the last peak in August 2022 has been broken.
The last two sessions clearly depict a fight between bears and bulls won by the bulls.
EOSUSDT is trading just below EMA50 with a short-term bullish bias.
Additional growth can happen.
We can see a target mapped at 60%.
Easy target can be found at 30% above the current price.
This chart is similar to many other Altcoins, more evidence pointing to a new relief rally for the cryptocurrency market ahead.
Namaste.

EOSIdea: The price may form a bullish double bottom pattern. Perhaps it is already forming, or the price will again fall to the trend line and begin to form a trend reversal.

eos usdtThis page is made solely for displaying price information and the status of the projects in the market, and does not mean investment or approval of the project

EOS - Technical review and analysisEOS reacted negatively during the last week, right after hitting the resistance of the $1.03-$1.04 range. Also, the support in the range of $0.950 to $0.96 was again a good demand area that triggered the activation of buyers' orders. EOS currency can still have a range trend in 4 hours. But this area has increased one step upwards. Therefore, we can continue the range trend in the current week's ranges indicated on the chart. Also, until this support is broken, the EOS trend will not go down in the 4-hour timeframe. We can monitor price fluctuations more closely by drawing an upward trend line or an upward channel. As long as this trend line or the bottom of the channel is maintained, we can expect price growth.

EOS Potentially Double Bottom 1W TimeframeEOS has the potential to double bottom on large timeframes, it can also be marked with a reversal pattern like on the chart. now is the best time to enter the market slowly.

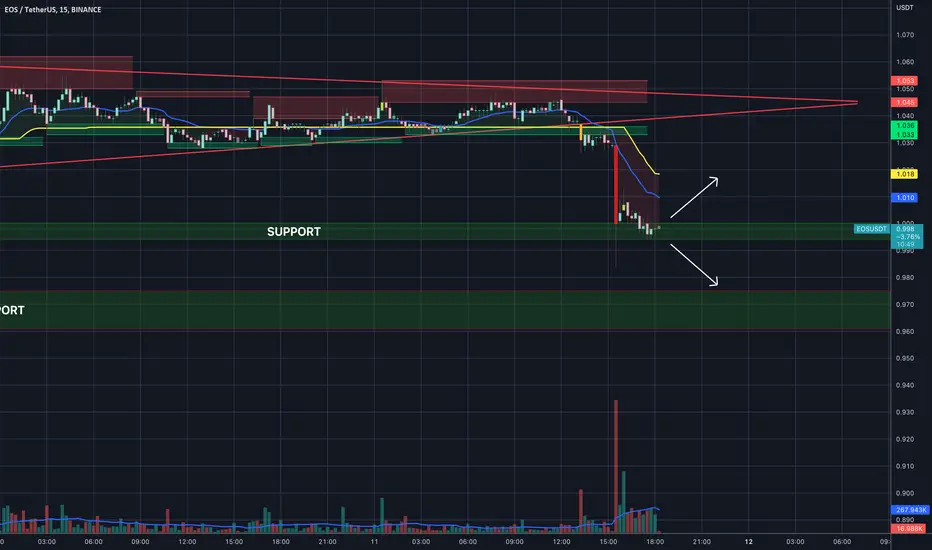
EOS - 12/11 - 1hr Chart UpdateEOS - 12/11
The price just broke from a triangle pattern and now it's trading on it's support level which is a good zone to begin a short or a long. On lower timeframes (15m) it's forming a descending channel.
I'd recommend to setup some alerts on $1 and $0.99 which is the first support range and wait for a confirmation (trading above or below the support range) in order to open a long or a short position.
*Candle color indicates volume .
EOS: IF THIS HAPPEN EOS WILL MOON AS THE CHART SHOWSEOS is expected to remain an important player in the cryptocurrency world in the coming months and years. Twitter is reportedly working on a new payment system that may integrate with EOS. This news about the wallet integration comes from Jane Manchun Wong, she has previously reported on Twitter's about adding a cryptocurrency wallet to its platform.
The potential partnership between Twitter and EOS is not guaranteed, and the exact details of the payment system are not yet known. However, if the partnership does come to fruition, it could be a major boost for EOS and its adoption as a payment system.
EOS until now has the best payment system the fast one and the old one, and the team had more connections with Elon musk let us expect that this can happen.
ELon muks can also have the choice to make their own system, but as we said the change will stay high that EOS can become.
There is a high chance Elon musk will choice for a system that is the best and guaranteed for the long term, and a system that has already been placed on other social media with proof of working.
As always, it's important to remember that cryptocurrency is a highly volatile and unpredictable market. This information should be considered with caution, and investors should do their own research before making any decisions.
It seems the payment system coming soon.. as there are some trends going on twitter.
For more details read about the study
This will stays an expectation that can happen, and it's not trading advice, or that you should follow this.
Do always study as we never will know exactly future what will happen, but if it happens, then, at last, we did know about the partnership of EOS and expected well.

Sell Eoshi as You see price is reach to Great Ressitance
so you can take short position with 2X leverage
enhoy it

EOS the black box is very importantthe black box is very important. Maybe in the next few days the market will explode in a short time.

EOSUSDTOverall Moving In descending Broadening Wedge In daily Timeframe
Recently Breaks Descending Channel In Daily Timeframe Now Expecting Breakout Of Descending Channel too Incase Of Breakout Target Would Be 3$

EOSIdea: the price broke through the daily 50 MA. The next indicated MAs and trend line can become very strong resistance and the price will bounce down to 50 MA. Possibility of forming a cup and handle pattern

EOS : SEEM TO ENTER NEW BREAKOUT AFTER USDT TEST VIEWEOS is a cryptocurrency that is known for its long-term stability and fast blockchain. It has previously reached prices above $14, with a market cap of over $12 billion. Currently, there is expected that EOS could enter a new breakout phase, potentially pushing its price up by more than 30%, due to potential support from the USDT stablecoin. However, this has not been confirmed and should be treated with caution
Additionally, EOS has a payment system that is already being used on social media, and there have been rumors of potential partnerships with companies such as Twitter and Elon Musk's companies. However, these rumors should also be treated with caution and should not be relied upon when making investment decisions.
It is important to always do thorough research before entering any market.
We will see if this USDT view can support EOS to break out in the coming time.
USDT
If this will not stay only by testing and gets confirmed coming time, it's able to breakout EOS with 30% And UP, as we have not seen EOS for a long time not increasing so much.
We did expect before also BNX on DCA transactions.
See more about the Twitter view:
Thanks for your like and follow

EOSUSDTEOS is a blockchain protocol based on the cryptocurrency EOS. The smart contract platform claims to eliminate transaction fees and also conduct millions of transactions per second. It was developed by the private company Block.one and launched in 2017.

HIGH STUDY - THE PAYMENT SYSTEM PROCESSING OF TWITTER IS EOSExpecting That EOS will play a very huge role in Twitter's coming time.
EOS is more able to do this for more reasons and there are some connections. ( and EOS already has beta version)
it's not the first time that EOS has made some connections with social media, and I think it's only about time before we are going to see some trends.
EOS is the old one, and with the most expertise in the domain of social media payments processing.
Elon musk is a businessman and will choose the best one!
EOS already has a payment system that ready can be for Twitter at any time
They already have a complete payment system ready for use.
There are some important connections will share later.
will share soon the most important trends, as this is only the start view.
When there are more signals about this we can see even the price returning to 20 USD
Never trade on this, as it bases on the study. and this is not trading advice.
Time will learn if this is right or not
Expecting that EOS is the possible payment system for Twitter.

EOSUSDTHello Crypto Lovers,
Mars Signals team wishes you high profits.
This is a one-day-time frame analysis for EOSUSDT
Obviously, there is R2 as the resistance area in which the price was not able to rise upward at some points. R1 used to be a support area. S2 is a long-term support area and also S1 is a 4-hour support line with its well support of price at it. Thus, we have the price fluctuating below R1 and our expectation would be a rise to reach the mentioned line. Then we must for some signs in order to have a rising or a falling trend to predict. If we have some confirmation candles as rising signs, the price is expected to reach upward to R2. Even it is probable that the price is rejected at R1 and more fall happens to it to S1 or more. The future reveals everything.
Warning: This is just a suggestion and we do not guarantee profits. We advise you to analyze the chart before opening any positions.
Wish you luck

Bottom's in for EOS imo but idkEOS seems bottomed but it's just a wild guess with a wild prediction :)

EOSEOS is forming a triangle pattern. When the price reaches the specified resistance with the formation of a candle, it confirms the position of the short trade

KEEP AN EYE ON EOSOur algorithm detected one more strong buy which is eos, use proper risk management and be ready for breakout

Triangle pattern is forming!In the daily time frame, another support was confirmed in the $ 0.816 - 0.80.
Currently, an ascending triangle pattern is forming, which confirms the acceptance of the current price in the range of 0.940.
The break of the ceiling of this pattern can be accompanied by the break of the ceiling of the descending channel and increase the probability of continued growth up to 1.206.

#EOSUSDT 4H Chart
Price has tapped into the 4h demand zone and moved up from there as expected. MACD is not clear, RSI and EMAs are neutral. Price should keep moving up from here aiming towards the $0.94 area before potentially moving down again.
