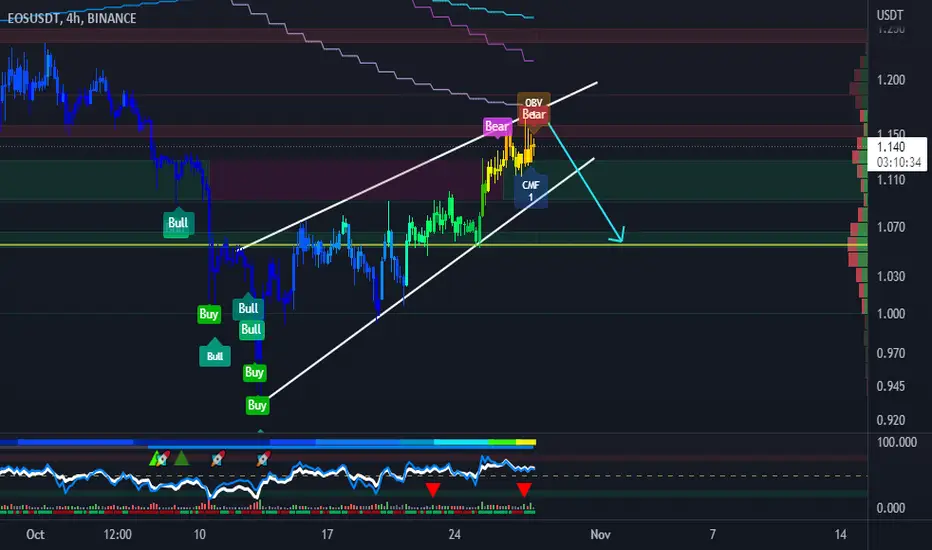
EOS Either OrFollowing the "obvious" levels here for EOS. I might have to wait a while for these to execute but I'm quite confident in the probability that I will have the opportunity to take a modest profit at these areas when the time comes. 3% of the value of my account at 20x,
EOSUSDT trade ideas

EOSUSDT Elliott Waves AnalysisHello friends.
Please support my work by clicking the LIKE button👍(If you liked). Also i will appreciate for ur activity. Thank you!
Everything on the chart.
Entry: market and lower
Target: 2 - 2.4 and maybe 3
after first target reached move ur stop to breakeven
Stop: im w/o stop (depending of ur risk). ALWAYS follow ur RM .
Risk/Reward: 1 to 5
risk is justified
Good luck everyone!
Follow me on TRADINGView, if you don't want to miss my next analysis or signals.
It's not financial advice.
Dont Forget, always make your own research before to trade my ideas!
Open to any questions and suggestions.

EOSIdea: The price formed a bearish wedge. The price will drop to the POC level after an unsuccessful attempt to break through the daily 50 EMA / MA
EOSUSDT possible ascending triangleAscending triangles are a bullish formation that anticipates an upside breakout.
Wait for breakout.

EOS - Bearish divergenceEOS has recently rallied together with the whole crypto market but its price action is starting losing momentum.
On the 1H timeframe, higher highs in price did not follow with RSI which right now is showing a bearish divergence.
Short set-up
TP: $1.09
SL: $1.155

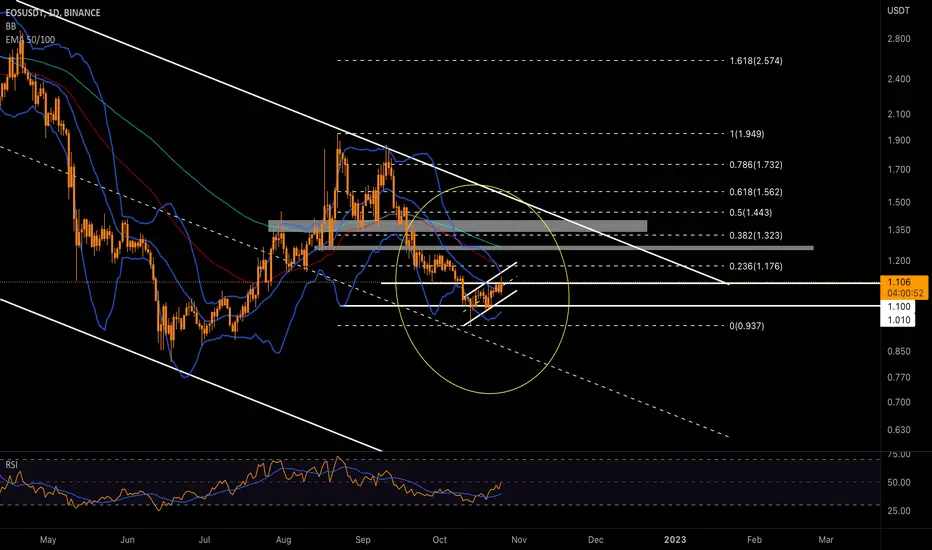
EOS Descending ChannelEOS, which has been in the descending channel since August 2021, has proven to investors how strong it is with its re-entering the channel in August, although it entered dangerous positions when it broke down the channel in May 2022. If the channel breaks the upper resistance in a possible bullish scenario, the $1.90 and $3.20 levels are resistance. If the channel is rejected at the upper resistance, the $1 level will be supported.

Short EOS Short EOS 1.125 - 1.135
Short EOS 1.125 - 1.135
Short EOS 1.125 - 1.135
Short EOS 1.125 - 1.135

Buyers need to return the price above the $1.10 range!EOS has recorded a 10% price growth over the past week. The good reaction to the support range of $1 has been accompanied by good support from buyers and has caused the price to grow to the resistance range of $1.071 to $1.10. As you can see, the trend of the price of this currency has decreased again in the daily period, but in the 4-hour window, the buyers' efforts to make the trend upward have formed higher ceilings and floors. But for the final confirmation of the upward trend in the four-hour period, buyers need to return the price above the $1.10 range. In this case, we can expect the price to grow at least to the targets of 1.25 to 1.27 dollars.
The next target in case of further support is in the resistance range of $1.34 to $1.40; in this area, we expect a negative reaction and some short-term buyers to save their profits. At the time of writing this analysis, the price has hit the midline of the short-term ascending channel. In general, as long as the bottom of this ascending channel is maintained in the support area of $1.010, there is a possibility of breaking the specified resistance. Also, in lower time frames, you can consider breaking the trend line as a positive signal and more support for buyers to break the $1.10 resistance and stabilize above it by drawing a downward trend line, for example, in the one-hour time frame.
#EOS short ideaHello dear Traders,
Here is my idea for #EOS
Price closed below yellow line (previous month low)
Price closed in 15 Minute chart below purple trigger line -> Enter Trade.
Targets marked in the chart (black lines)
Invalidation level marked with red line
Good luck!
❤️Please feel free to ask any question in comments. I will try to answer all! Thank you.
Please, support my work with like, thank you!❤️

🔴 EOSUSDT - 4H (22.10.2022)🔴 EOSUSDT
TF: 4H
Side: Short
Pattern: Bear Flag
SL: $1.1258
TP 1: $1.0562
TP 2: $1.0344
TP 3: $1.0167
Bear flag has formed on the 4H and the RSI is showing overbought so I believe EOS is going to crash sooner or later.

EOS/USDT Short📉📍 Eosusdt
🔰SHORT
🔴Sell Now or Sell at : 1.064
⛔️Stop Loss : 1.099
🌀Take Profit 1 : 1.038
🌀Take Profit 2 : 1.026
🌀Take Profit 3 : 1.008
P.S. THESE ARE ZONES NOT LEVELS
15m trend looking bearish but has no strength so I am expecting little bit of range like movement
45m trend looking very good for bears.If bears remains strong we can see strong movement downside
2hr short term trend is bearish but long term trend is in the bullish zone so we have to be careful
P.S.THIS IS NOT A FINANCIAL ADVICE

Bearish wedge for EOSThe bearish wedge is creat here to short position as you can see in rsi creat a triangle too
Please be patient to breakout

EOSIdea: A bearish wedge is formed and many bearish divergences are formed, the price will break the lower border of the wedge. Price will rise to the daily 50 EMA in case of strong bullish momentum

EOSUSD ❕ ascending wedgePrice formed an upward wedge on a correction after a decline.
The wedge was formed on declining volumes.
RSI and EOS formed a bearish divergence (1H TF)
Price has broken down 50EMA (30m TF)
I expect the EOS to start declining after it has consolidated under the resistance level.

EOS : 3 USD TARGET PLAN I know that most of the traders waiting to see EOS coming out of the 1 USD zone, and we have seen before more times that EOS did show an increasing trend.
Since last time EOS shows signals for possible increase, and this can bring EOS to target 2-3 USD in the coming time.
It is good to have a plan if you want to go with the trend of 3 USD.
DCA is a good product to use. monthly or weekly
There is a high chance that EOS will see soon a trend pump.

#EOSUSDT 1H Chart
Price is currently getting rejected from a 1h breaker zone. MACD is turning bullish, RSI is bought and EMAs are neutral. Overall, i still expect price to move up towards the daily supply around $1.15 before potentially moving down again from there.

The possibility of EOS price moving towards 1.22Price previously left an area of equal lows at $0.99 and moved up from there. I expect price to tap into the daily supply around $1.22 before moving down aiming for the equal lows.

EOSUSDT s&rscalping plan for limit orders - Risk Disclosure: Trading in financial instruments and/or cryptocurrencies involves high risks including the risk of losing some, or all, of your investment amount, and may not be suitable for all investors. Prices of cryptocurrencies are extremely volatile and may be affected by external factors such as financial, regulatory or political events. Trading on margin increases the financial risks.

EOS : BREAKOUT TARGET EOS seems on a very important frame for a breakout since the last breakdown trend that did take EOS to break down to below 1 USD.
It seems that EOS has a high possibility to enter new increase
The expected target is between 1.54 -2.20 USD
Markets can be very hard, so please think about your SL on any trades you made.❤️

EOS : DAY TRADEEOS: DAY TRADE
Interesting to check the last trends.
It's a coin that did stay for a long time into a breakdown trend.

EOS Long Entry set up EOS Seems bullish in 1D time frame. It is breaking down trendline of RSI and could give good profit in long - Study idea for SL

EOSThe price has broken through the 50 EMA. The price will rise to 100 EMA/MA if it fixes above 50 MA. I expect a wedge to form. Price will rise to 200 EMA in case of very strong bullish momentum

EOS Long IdeaThis is my Idea for EOS long.
Very easy Invalidation.
Please manage your risks!
Cheers.
