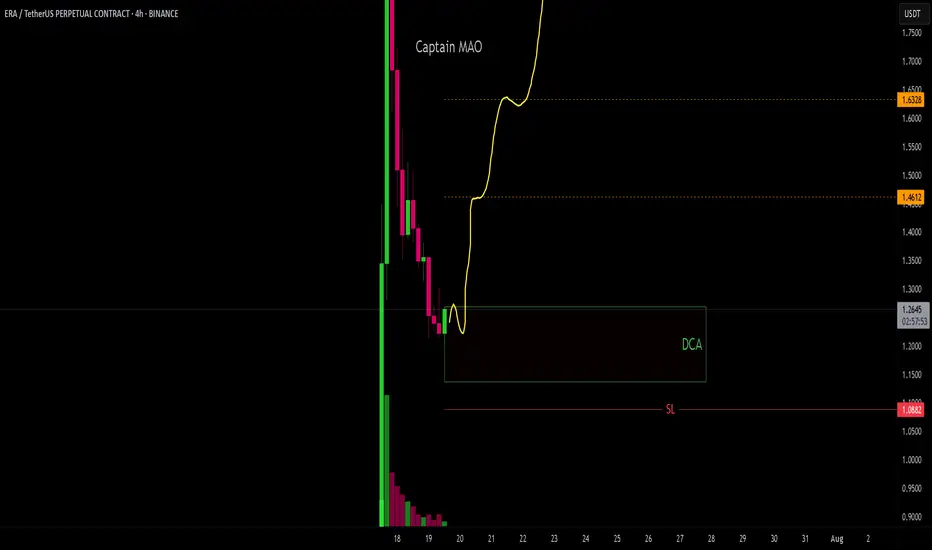
ERA/USDT - new ATH!!a newly listed coin on major exchanges, has dropped nearly 40% from its initial peak and is now trading around $1.25. After the sharp sell-off, the price is beginning to stabilize and form a strong support base, signaling a potential trend reversal setup.
This zone offers a solid opportunity for early positioning as buyers begin to step in and absorb selling pressure.
ERAUSDT trade ideas
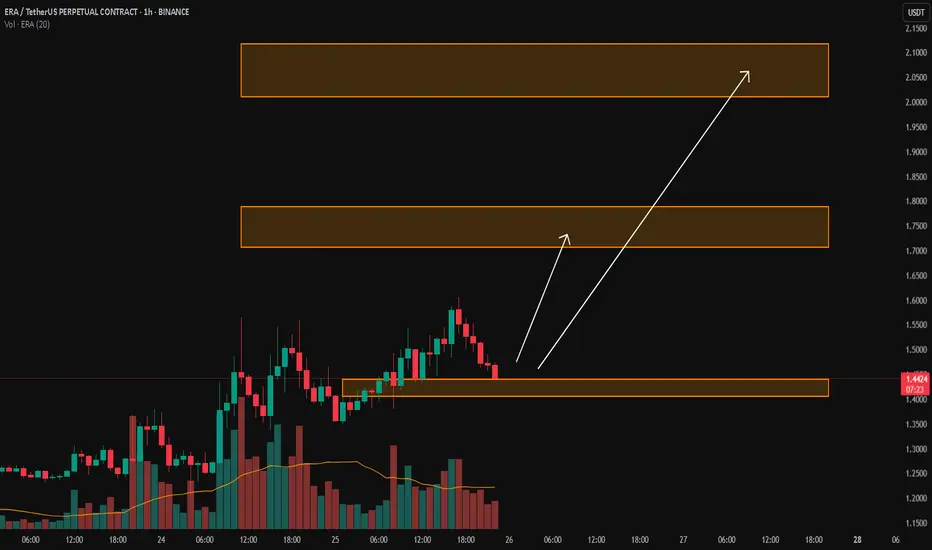
ERAUSDT Forming Bullish FlagERAUSDT has caught the attention of traders after a strong impulsive move that has laid the foundation for a possible continuation of its bullish trend. The current structure appears to be forming a classic bullish flag/pennant formation, a pattern often observed in strong uptrends, where price consolidates in a narrow range before breaking out higher. With volume supporting the recent breakout and price action showing resilience near consolidation support, this setup presents an exciting upside potential.
The projected gain of 90% to 100%+ aligns well with the technical structure seen on the chart, especially considering the momentum-driven environment ERAUSDT is trading in. As price continues to coil within a tight range, it builds the energy necessary for a decisive breakout. The bullish sentiment surrounding the ERA ecosystem, coupled with increasing interest from speculative and long-term investors, could be the fuel needed to push this pair into a significant rally.
Fundamentally, ERA is beginning to draw more eyes from across the crypto community, possibly due to developments or partnerships that are elevating its profile. This blend of technical readiness and rising investor interest makes it a coin to watch in the short to mid-term. If bullish confirmation holds, the next leg could be sharp and aggressive, potentially achieving or even exceeding the projected 100% target.
This is a moment where traders who rely on high-reward momentum setups could benefit by monitoring this pair closely. With risk well-defined below recent lows and the structure signaling strength, ERAUSDT deserves a spot on every active trader's radar.
✅ Show your support by hitting the like button and
✅ Leaving a comment below! (What is You opinion about this Coin)
Your feedback and engagement keep me inspired to share more insightful market analysis with you!

ERA/USDTKey Level Zone: 1.4050 - 1.4400
LMT v2.0 detected.
The setup looks promising—price previously trended upward with rising volume and momentum, then retested this zone cleanly. This presents an excellent reward-to-risk opportunity if momentum continues to align.
Introducing LMT (Levels & Momentum Trading)
- Over the past 3 years, I’ve refined my approach to focus more sharply on the single most important element in any trade: the KEY LEVEL.
- While HMT (High Momentum Trading) served me well—combining trend, momentum, volume, and structure across multiple timeframes—I realized that consistently identifying and respecting these critical price zones is what truly separates good trades from great ones.
- That insight led to the evolution of HMT into LMT – Levels & Momentum Trading.
Why the Change? (From HMT to LMT)
Switching from High Momentum Trading (HMT) to Levels & Momentum Trading (LMT) improves precision, risk control, and confidence by:
- Clearer Entries & Stops: Defined key levels make it easier to plan entries, stop-losses, and position sizing—no more guesswork.
- Better Signal Quality: Momentum is now always checked against a support or resistance zone—if it aligns, it's a stronger setup.
- Improved Reward-to-Risk: All trades are anchored to key levels, making it easier to calculate and manage risk effectively.
- Stronger Confidence: With clear invalidation points beyond key levels, it's easier to trust the plan and stay disciplined—even in tough markets.
Whenever I share a signal, it’s because:
- A high‐probability key level has been identified on a higher timeframe.
- Lower‐timeframe momentum, market structure and volume suggest continuation or reversal is imminent.
- The reward‐to‐risk (based on that key level) meets my criteria for a disciplined entry.
***Please note that conducting a comprehensive analysis on a single timeframe chart can be quite challenging and sometimes confusing. I appreciate your understanding of the effort involved.
Important Note: The Role of Key Levels
- Holding a key level zone: If price respects the key level zone, momentum often carries the trend in the expected direction. That’s when we look to enter, with stop-loss placed just beyond the zone with some buffer.
- Breaking a key level zone: A definitive break signals a potential stop‐out for trend traders. For reversal traders, it’s a cue to consider switching direction—price often retests broken zones as new support or resistance.
My Trading Rules (Unchanged)
Risk Management
- Maximum risk per trade: 2.5%
- Leverage: 5x
Exit Strategy / Profit Taking
- Sell at least 70% on the 3rd wave up (LTF Wave 5).
- Typically sell 50% during a high‐volume spike.
- Move stop‐loss to breakeven once the trade achieves a 1.5:1 R:R.
- Exit at breakeven if momentum fades or divergence appears.
The market is highly dynamic and constantly changing. LMT signals and target profit (TP) levels are based on the current price and movement, but market conditions can shift instantly, so it is crucial to remain adaptable and follow the market's movement.
If you find this signal/analysis meaningful, kindly like and share it.
Thank you for your support~
Sharing this with love!
From HMT to LMT: A Brief Version History
HM Signal :
Date: 17/08/2023
- Early concept identifying high momentum pullbacks within strong uptrends
- Triggered after a prior wave up with rising volume and momentum
- Focused on healthy retracements into support for optimal reward-to-risk setups
HMT v1.0:
Date: 18/10/2024
- Initial release of the High Momentum Trading framework
- Combined multi-timeframe trend, volume, and momentum analysis.
- Focused on identifying strong trending moves high momentum
HMT v2.0:
Date: 17/12/2024
- Major update to the Momentum indicator
- Reduced false signals from inaccurate momentum detection
- New screener with improved accuracy and fewer signals
HMT v3.0:
Date: 23/12/2024
- Added liquidity factor to enhance trend continuation
- Improved potential for momentum-based plays
- Increased winning probability by reducing entries during peaks
HMT v3.1:
Date: 31/12/2024
- Enhanced entry confirmation for improved reward-to-risk ratios
HMT v4.0:
Date: 05/01/2025
- Incorporated buying and selling pressure in lower timeframes to enhance the probability of trending moves while optimizing entry timing and scaling
HMT v4.1:
Date: 06/01/2025
- Enhanced take-profit (TP) target by incorporating market structure analysis
HMT v5 :
Date: 23/01/2025
- Refined wave analysis for trending conditions
- Incorporated lower timeframe (LTF) momentum to strengthen trend reliability
- Re-aligned and re-balanced entry conditions for improved accuracy
HMT v6 :
Date : 15/02/2025
- Integrated strong accumulation activity into in-depth wave analysis
HMT v7 :
Date : 20/03/2025
- Refined wave analysis along with accumulation and market sentiment
HMT v8 :
Date : 16/04/2025
- Fully restructured strategy logic
HMT v8.1 :
Date : 18/04/2025
- Refined Take Profit (TP) logic to be more conservative for improved win consistency
LMT v1.0 :
Date : 06/06/2025
- Rebranded to emphasize key levels + momentum as the core framework
LMT v2.0
Date: 11/06/2025
- Fully restructured lower timeframe (LTF) momentum logic
ERA USDT NEXT VIEW Era Usdt looking goods from her for long position
Looking strong technical Analysis 🏆
