Potential reversal to retest upper resistance (30% move)Disclaimer: I am not a professional trader and this is not financial advice, just an idea of what I see. Crypto has a high risk/high reward ratio and moves faster than traditional markets. Only bet what you can afford to lose.
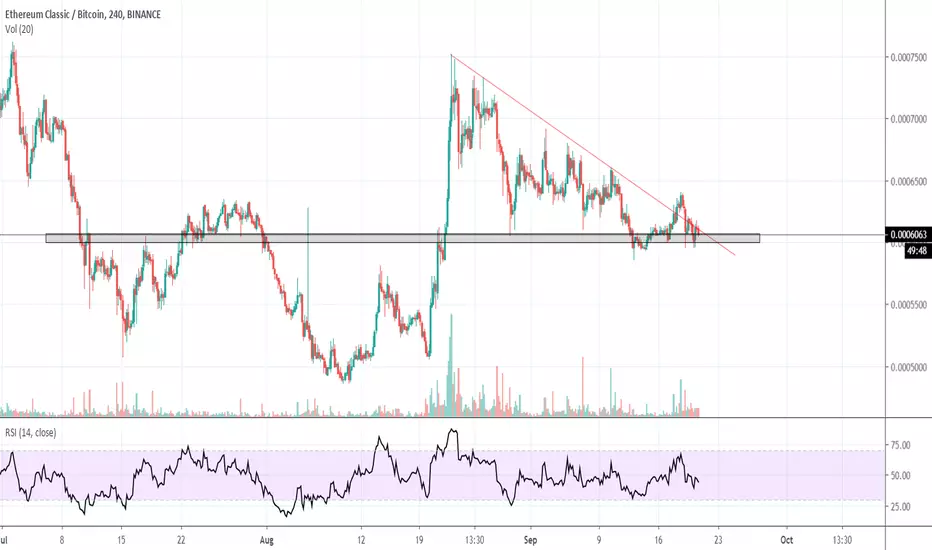
ETC has been trading sideways since end of June.
There's seems to be a double bottom that has formed on the support level.
We can see a falling wedge pattern that we broke out off about a week ago before falling back down, ETC is however for now bouncing off a strong shorter time support line.
Either of 2 things is likely to happen:
1: the current support acts as a trampoline and send ETC to retest a pretty big resistance level, effectively sending the price to touch the 200 MA. This would mean a 30% price gain from where we are now.
2: the current support breaks and we either bounce off the upper trend line of the falling wedge or we go retest the larger support area below. If the later happens, this would form a tripple bottom on ETC.
How I would trade this:
Enter a position at the current support level, your target is 30% higher. I would probably set a stop at around 52000 satoshis and get it to place a sell order at around 47000 satoshis. ETC has seen some pretty harsh sell offs in very short time periods (10-15% within 2 days) in the current falling wedge formation but it also each time bounced back up, you don't want to get your position taken out to quickly.
ETCBTC trade ideas

ETCBTC REVERSAL (1000%+)ETCBTC JUST BROKE THE FALLING WEDGE REVERSAL PATTERN, WAIT FOR THE CONFIRMATION OF THE BREAKOUT AND THEN BUY..

$ETC, Price recovering from ATL BTC values at ~50k sats..$ETC
Price recovering from ATL BTC values at ~50k sats, Crossing over resistance level at ~55k sats with increasing volume & UCTS Buy signal on daily chart..
Looking for a flip here over the following hours/days as potential entry
Targeting ~62K sats
#ETC
Managing my stop losses, take profits and trades over 3commas platform for Binance has been a great experience.
I have to do a few clicks and everything is managed automatically by the platform..
Thanks

ETC Measured Move ETC broke out and I think its going to make similar measured move upside as previous one.
RSI broke out and moving up
MACD is moving up as well
BUY at the retest or now
Targets and SL are on the chart


ETCBTC Trading IdeaCompleted Bat Pattern. Price action is accumulating 1.618 BC so we will see a break above this level soon. Do keep in mind the movement of the bitcoin as bitcoin makes big moves this analysis might fail.
Targets : 6203 | 6463 | 6707
StopLoss : Below 4800

Ethereum Classic Potential TradeProbably can make 30% profit.
Falling wedge has been broken, heading to test resist again.

ETCBTC Bull scenarioConsidering oscillators are bullish showing a bullish divergence play along with Elliott Wave hitting at 100% Fibonacci ratio saying that correction phase is over. Likely ETCBTC correcting is done and we're on our way to an impulsive rally.
Bear scenario if it breaks support.

ETC - Inverted hammerTrue not a huge volume but I think it will build up slowly.
6200
7200
are the targets
Remember, this is not a financial advice. Do your own studies.
Thanks!


ETCBTC on Support Near to breakout right now alts pumping one by one very hard
so watch this coin it can pump and also reacted on support
so watch this there is no retest after breakout sell or buy with sl we are in short season
Ethereum Classic going to dump ?ETC possible drop, MACD bellow zero line, bearish trend line possible drop to 5800 after 5500 support ?


ETCBTCTriangle output can be both ways
The indicators are neutral with a bearish note
Open position by the breakdown of the triangle

ETCBTC BINANCE Break-out. should watch. 123%+ possible profit. wave 3 is going to start with a bullish break-out. this is going to be a wild rocket ride!


ETC triangle Pump or Bye ByeETC ended up Bearish Crab Pattern and now forms Triangle. In which way will ETC go ? I´m still bullish, so my buy zone and stop loss is in chart. Real target is sooo high. Perfect Risk Reward Ration !

Buy #ETCBTC on Dips - Set Alarm for the Buy ZoneBuy #ETCBTC on Dips - Set Alarm for the Buy Zone
7 Days Swing Trade
540-551 - Entry
612-625 - Target
511 - Stop Loss
Medium Risk
Valid Until September 21st
