ETC-BTC 4Q 2018/ 1Q 2019It is not a trade council, you answer all your financial investments personally with your money.
ETCBTC trade ideas

Breakout inevitable?Long term horizontal support seems to be holding. Expecting a breakout in October unless we break below 0.00166.

Could ETC be the next alt to break out within the next 7 days?ETC has been relatively unaffected by other alts pumping so far. However the signs right now are really bullish, I have annotated them all on the chart. If it breaks my expectation would be to ride gains of 40% to 90% within less than a month.


ETC a good playerI think ETC is a great hold and is relatively cheap compared to where it was at a month ago.
If you consider that ETC was around $20 after a pump and went down to $10, then slipped around $13 for awhile you'll
notice that it's around $11.50 now and may never be that cheap again. I used usd pricing for understanding, of course btc is better indicator but having usd
for getting ETC is really appetizing. Not financial advise, just an interesting prospect

watching ETC to hold supportI am keeping a close eye on ETC both versus $BTC and USD(t) I feel with its recent addition to coinbase, any rally in the broader markets will propel ETC to being one of the top performers. Also seeing a slight increase in twitter/reddit activity on this name.....
they are both sitting right near pretty decent support areas. I am focused more on the ETC/BTC chart but I am seeing both as offering a decent technical view.
/BTC i would be looking for an entry as close to 1800 while playing the breakout from the down-trending line.
Areas to watch for me are 2000 and 2330 while risking about 7 % on the downside with a stop at 1675
/USD(t) is a little trickier with the risk:reward, more specifically on the downside/stop price. 11.50 seems like good support area, and would be looking to get an entry as close to that as possible. On the downside, having a stop loss below the lowest low would make the R:R ratio too imbalanced for my liking, and even moving it to 10.40 would be 9%.
I feel my upside targets are somewhat conservative, so I am willing to stretch the R:R a little bit to what i am usually looking for; and not necessarily selling at those prices, but re-evaluating its strength.
Of course, this is predicated on what BTC itself does.

ETCBTC without emotion interference The blueish rectangle showing very peculiar price action which took place on the first half of august. This strong bullish movement was wiped out with couple of days and pull it down below the most important support/resistance level for this pair which is 0.02.
I can see 2 possible scenarios the pair will be pull down by 200 EMA on 4H chart and most likely 0.02 level will no be breached or Pair will do another attempt to go above mentioned level and then it will be pulled down by 200 EMA towards 0.01.
If my scenario is correct ETCBTC should stop for while around 0.013700 and then try to reach 0.01.
The pinkish rectangle refers to strong support/resistance area when closing short position is not a bad idea.

Ethereum Classic (ETC): Marking Pivots, Resistances & Fibonacci!A deep and detailed look at the pivots and resistances + fibonacci for the ETC/BTC pair.
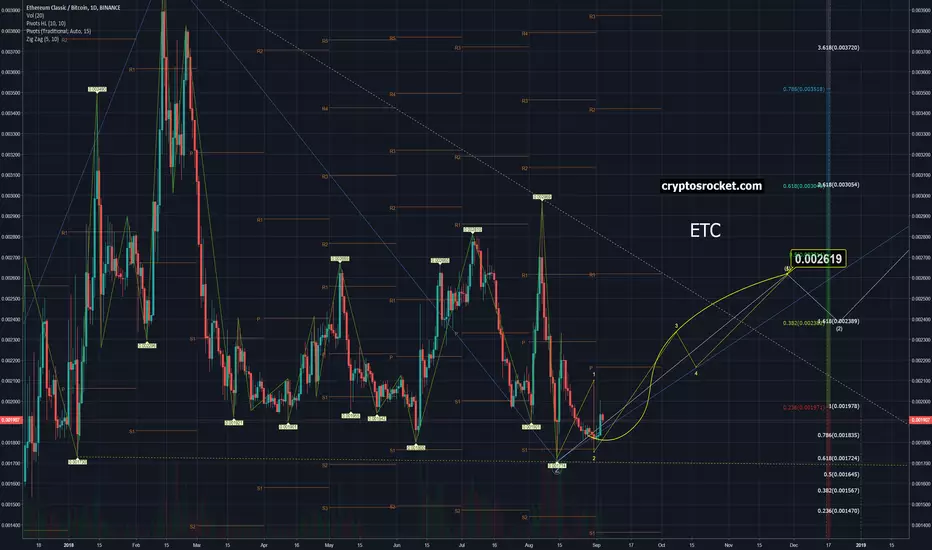

Ethereum Classic (ETC) Update: Target 0.002619 BTC (+34%)!!After anticipating the reversal in the last post... this is the primary count target at the moment for EthereumClassic (ETC)!
Target 0.002619 BTC!!
Profit potencial: 34%

ETC Long Term Trading IDEACurrently, ETC is at its lowest. You know that the coin base listing news drove the price up to 2900 satoshi.
When the bull run starts, you will never find ETC this cheap. It is good time to accumulate some ETC for long term.
Best of luck!

ETC: whale, is that you?Hello everybody!
I am a big believer in ETC. I supported the STACK EXCHANGE branch opening back in the days and you can see in my twitter that I was reposting the idea of adding ETC to Coinbase since february this year.
After Ethereum 1-st wallet launched a year almost passed and ETH become >$1000
Not so long ago we saw Emerald wallet.
So what do you think? Are we going to see ETC x100 next year? Leave your comments below.
Thank you and bye bye!


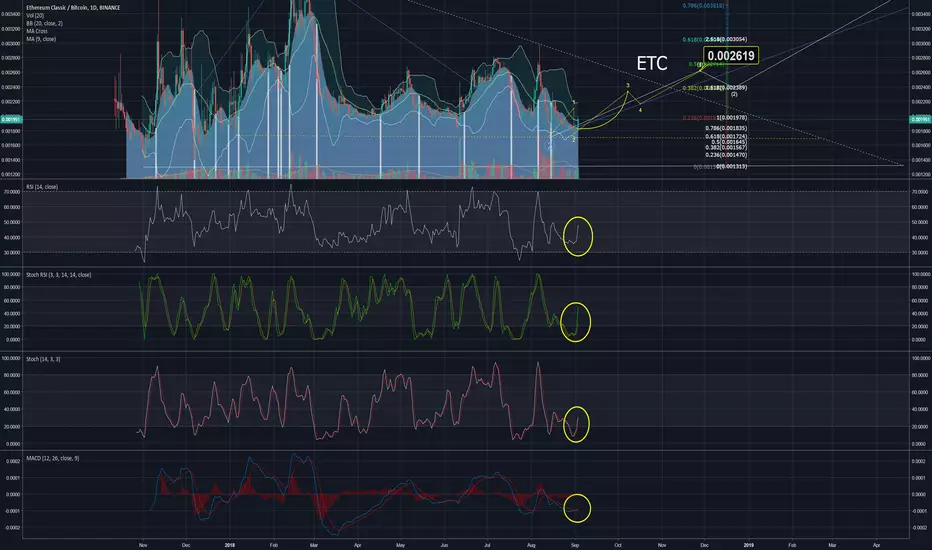
Ethereum Classic (ETC) Update: Time for jump in is coming!!Almost at the bottom of Bollinger Bands... Note how we're going "out of water" and look that pump above 0.002 today! Things are getting interesting here.
