ETCBTC trade ideas

ETC/BTC trade for a nice +16% profit!The setup on 4h TF was at the price of 0.0013573
The trade slowly went forward and our 12h TF setup was activated. We are using multiple time frames to determine our entrys, so we moved to 12h TF and now following the trade on the 12h TF. The trade was updated, we had our TP at 0.0015720
The trade went our way and hit TP for a nice +16% profit!!!
Trade closed, ₿₿₿₿₿ in the bag!
Trade safe and wait for our next setup!

ETC/BTC Potential GAINIn one day timeframe when the MACD was positive after a range market in the past, we faced a price increase. A similar scenario is happening now and one more thing! Price crossing bearish trendline. According to the BTC.D, BTCUSD, TOTAL and ETCBTC charts I think this is a opportunity to BUY ETC. I use HODL Strategy but if you are a day trader you can use TP1=0.00271, TP2=0.00325, TP3=0.00400

ETC Breakout And Retest Done !Another bullish pattern in the ETC chart. Breakout and retest have been already done. Buy it with low risk and hold it with patience.

Ethereum Classic 💥🔥 $ETC #ETC Ethereum Classic has broken a 90-day downtrend pair of bitcoin and is ready to move higher. Its resistances and goals are plotted in the diagram.
Currently, due to the increase in the bitcoin range and its movements, all altcoins will be affected by it. The analysis is just a series of probabilities.
I hope you find this analysis useful🌹
Follow for more...

Ethereum classic. vintage is goldHere we are
demo kena barey?
with a lower fees.
how far this coin can maintain its value
forecast till end of this year.
Rank #19
Coin
On 240,219 watchlists
Ethereum Classic Price (ETC)
$43.35
0.001342 BTC1.98%
0.02143 ETH0.30%


$ETC, Testing upper trendline of a potential falling wedge...$ETC
Worth keeping an eye on this asset as its testing upper trendline of a potential falling wedge...
Volume curving up as UCTS is turning bullish on the 1D & lower timeframes..
As potential target, ~75k/85k/97k sats
#ETC

Ethereum Classic (ETC) | The Lone RunnerHi friends, hope you are well and welcome to the new update on Ethereum Classic (ETC).
More than 1300% huge rally:
On 21st March I shared an idea when the price action of Ethereum classic completed the formation of a bullish BAT against the Bitcoin and entered in the potential reversal zone of this harmonic bullish reversal pattern. Finally, the priceline started a move towards the upside surged more than 1300% that was a huge rally.
A huge rejection:
After this powerful rally the priceline of ETC reached $180. The price action found the resistance at $140 because here we have several touchpoints. After being rejected by this level the price action moved down and broke down the $50 support level. Recently the priceline has again broken out the $50 resistance that was previously breaking the support and moving between the $50 and $60 support and resistance levels.
The SMAs.
While the price action found that support at 50 dollars, at the same time the price action went very close to the 200 simple moving average on the daily time frame. From here it moved towards the upside and broke out the 100 simple moving average again. At the moment the priceline of Ethereum classic coin is moving between the 50 and 100 simple moving averages. The 50 simple moving average is also working as a strong resistance for the price action. At this time it is very important for the Ethereum classic to save the supports of 100 simple moving average and the $50 at the same time.
Another bullish harmonic reversal pattern formed:
This time on the weekly time frame chart, the price action has formed the final leg of the bullish Gartley pattern. There is also an exponential moving average 21 support in the buying zone. I share this pattern a few days back on 27th June. So far the price action has surged more than 90% after hitting the weekly 21 exponential moving average support. This time the price action of Ethereum classic can surge more. Because the previous pattern was formed on the daily time frame whereas this has been formed on the weekly time frame. Therefore, we can expect a bigger move in the long term.
Conclusion:
On the weekly time frame chart the Bitcoin has broken down the EMA 21 whereas the Ethereum classic is still having good support of 21 exponential moving average on the weekly time frame and it has also formed a bullish harmonic reversal pattern. Therefore, there is strong chance that in the long-term the ETC will surge more against the BTC in the Bitcoin market like it did previously.
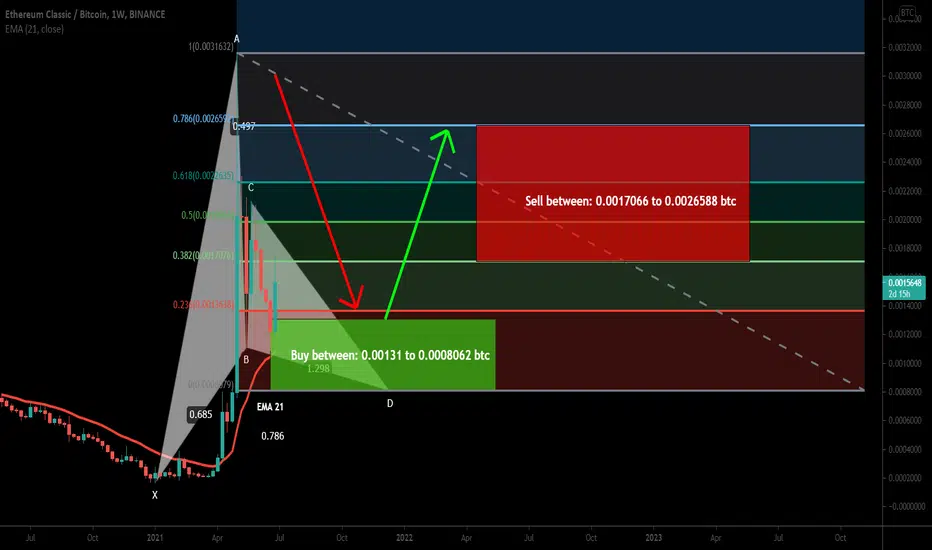
Ethereum Classic formed big Gartley for upto 229% bullilsh moveHi friends, hope you are well and welcome to the new update on Ethereum Classic (ETC) with BTC pair.
Previously we had a nice trade of ETC with BTC pair:
Now the weekly time frame chart, the price action has formed the final leg of the bullish Gartley pattern. There is also an exponential moving average 21 support in the buying zone.
Buy and sell targets:
Buy between: 0.00131 to 0.0008062 btc
Sell between: 0.0017066 to 0.0026588 btc
Stop loss:
The maximum extent of potential reversal zone 0.0026588 btc can be used as stop loss. Or to minimize the risk we can use the EMA 21 weekly as our stop loss.
Possible profit and loss ratio:
As per the above targets, this trade has a big profit possibility of 229%, and the high loss possibility is 39% and in case we use the weekly EMA 21 as stop-loss then the loss possibility is up to 16%.
Note: Above idea is for educational purpose only. It is advised to diversify and strictly follow the stop loss, and don't get stuck with trade.


ETCBTC Technical Analysis ETCBTC is still in the Bearish Flag . There might be Pullback at 0.0015273 but the price most probably will go to the upper band of the channel. if we get a break out of the Resistance there is a high chance that the price goes to 0.0021715
SL at Support Breakout
TP1 @ 0.0021715
TP2 @ 0.0027996


ETCBTC is trying to have a breakout 🦐the price is testing the upper trendline of the descending channel. IF the price will have a breakout, According to Plancton's strategy (check our Academy), we can set a nice order
–––––
Follow the Shrimp 🦐
Keep in mind.
🟣 Purple structure -> Monthly structure.
🔴 Red structure -> Weekly structure.
🔵 Blue structure -> Daily structure.
🟡 Yellow structure -> 4h structure.
⚫️ Black structure -> <4h structure.
Here is the Plancton0618 technical analysis, please comment below if you have any question.
The ENTRY in the market will be taken only if the condition of the Plancton0618 strategy will trigger.


ETCBTC daily Bullish Divergence Holding above 0.0019 where price history between that level and 0.0026 is only straight up and straight down. Getting there would mean over 30% increase on the USD pair.


ETCBTC Technical Analysis The Flag pattern is clear on the chart, there is a chance of hitting 0.001169 before the Flag breakout.
SL at the Support Breakout
TP1 @ 0.0015347
TP2 @ 0.001849
TP3 @ 0.002432

ETC.BTC (Y21.P4.Video1).Short Favourable.Hi All,
For a number of reasons, ETC is likely to lose alot against BTC.
All the best,
S.SAri


ETC/XBT - No comment t/p 2586
t/p2 3200
s/l 1777
r/r 3.95
Key an eye on the arbitrage in fiat
dont send ETC to exchange, please... 2345873544527457654 confirmations
HA!!!
