ETCBTC trade ideas

NEWBIE INCOMINGHi Guys, Newbie here.
You can call me Ed if you will be commenting on this.
I just recently started trading and I already lost money haha. Luckily, I started small so I lost small.
I only used Stoch RSI, BOLL, 4EMA in my analysis. If I were to trade, this is my long position. What can you suggest? Indicated also the stop loss and target profit area.

Profit Trailer 2 Settings! Tested with the PTstratX ScriptHello, Great Profit Trailer 2 Settings tested with the PTStratX script here on TV. Nice trades and good profit. EMAGAIN, SMACROSS, MACD and RSI in one strategy! If you like this information please give me a LIKE! Thank you

ETC-BTC a sleeping beast or dying oldman :)ETC has a lot of upcoming news on May and June. We should go up if we hold the trend line .


Careful with alts unless BTC can break 10,000A few coins bounced up today after everything bottomed out due to BTC dumps, If bears beat out the bulls we could see a retest of 10,000 before falling into the mid 8000's. fingers crossed that it can break 10,000 though.
In terms of ETC
We just saw a dump retesting the long term downtrend line but getting bought back up. currently resting on a short term support. We can expect a 6-15% bounce up from here while BTC retests 10,000.
WATCH very carefully if BTC is able to break 10,000 or not, otherwise youll end up holding bags for the next month or selling at a loss.

ETC - 5 wave up; wave 2 complete or nearing completionETC is a strong alt coin for 2018 and has been making steady gains since April 12th.
This is a good example of previous resistance levels now acting as support (Red line).
We also have a formed wedge which could provide the catalyst needed to begin wave 3.
Looking at the larger picture, if this pattern plays out we have a cup+handle formation with the breakout occurring on the 5th wave up, which could result in 100% or greater profits from current price level.

ETCBTC Buyon 4 hours ETCBTC and predict future uptrend. MACD shows oversoldat new lows so change in direction is bound to happen, currently in lower division bb band and macd cross is likely to happen soon.Once MACD cross happens would buy and set stop at 0.002277, or buy now.


ETHEREUM CLASSIC 4 HOURE SHORT TERM TARGETI DRAW SOME HORIZONTAL AND SUPPORT LINES
FOLLOW THIS LINES

ETC in an UptrendETC is in an uptrend as you can see in the chart.
Stoch RSI also shows that etc is oversold.
The MACD shows an downtrend that will likely stop at the yellow support line.
When BTC is stabilizes it would definitely help ETC to bounce.
You can try to enter at the yellow line and set a stop-loss below it.
This will bring you to a very good risk-reward ratio about 5.
My short-term target would be 0.382 fib-line(yellow line) for short-term but long-term I think it has much more potential.
This is my first idea so don’t be to critical please :)

Ethereum Classic BLASTOFF??okay, so we're seeing an obvious bull trend since early April and honestly if you were in any of "most alts", you hopped on Gain-Train to Cancun for Spring Break. BUT, ETC is just getting to a new FIB re-tracement level. As of May 6th bulls pushed pass .786 re-tracement level and is just starting to stabilize. Strong Buys around .0024500 range and ride that SOB into outer space for month or two!! Until some bearish trends start setting in around then, I'm HODL'n on like Jon Bon Jovi, Livin on a Prayer. First trend analysis. Ever. Your welcome. Lil Toshi OUT

ETCBTC: Buy timeHI Guys,
Here is my TA for ETCBTC. I think it will give us a good return. Diversion has been confirmed and it is a strong buy coin atm. I personally loaded some ETC.
Please DYOR before investing/ trading this.
Thank you guys


Ethereum Classic (ETC) - what is going on?Hello our dear crypto family.
Not expected gains on ETC? Impatient?
Let's take a look closer basing on technical analysis first.
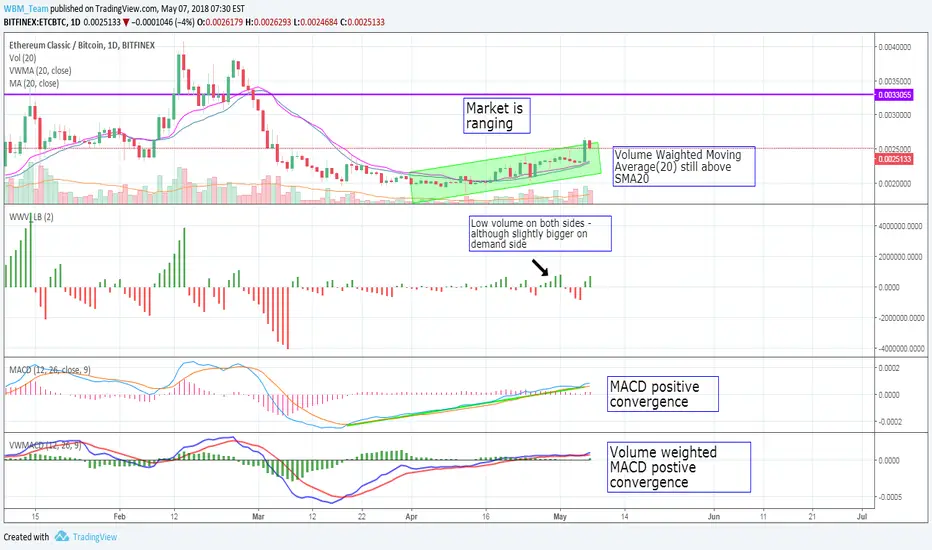
Market is ranging - we made 25% profit since mid April
Volume Weighted Average - very useful indicator to be combined always with Simple Moving Average - VWA is above SMA which is healthy and
positive. Price chart is above them two which confirms good trend. We have a convergence on price and VWA and SMA - GOOD.
Both MACD and Volume Weighted MACD show postive convergence so it is again healthy sign.
Let's jump to our recently favourite indicator - Weis Waves - unfortunately no big candles and a bit small volume. But it is not too bad. As we
can see there more green candels, green candels appear more often so presumably we can expect coininuing (slow?) growth. Waiting for more
candles with hopefully explict direction. Keep follow us for further updates on ETC
Moreover as we expect the new airdrop in mid July (listed below), we stay positive about ETC price in mid term.
Here is short description of what ETC is (for those who are new here):
ETC is one of two separate versions of Ethereum's Blockchain, the other being Ethereum itself. The split occurred after The DAO, a decentralized autonomous organization based on Ethereum, got hacked in June 2016, and $50 million worth of its funds were stolen. Because The DAO was crowdfunded, this event has resulted in a large number of people losing their stakes. After several weeks of heated debate, the community has decided to conduct a "hard fork" of Ethereum's Blockchain in order to "code" the stolen money back to its owners. In order to perform the hard fork, the majority of the users had to simultaneously take all the transaction records prior to the point of the hacking, and start anew from there, while discarding all transactions which have happened after that, including the hackers'. That doesn't mean that anything has happened to the previous version of the Blockchain - on the contrary, the hardfork resulted in two versions existing simultaneously: Ethereum -7.91% , which is the new one, and the old one, which was renamed Ethereum Classic.
ETC is in top 20 in terms of market cap. Backed by very good developers team as well as community. Devs are rated on 81% on coingecko and they have over 200k followers on Twitter (for comparison Eth has 400k)
We are going to have couple of events and good information regarding ETC. Here is the list:
24.05 ETC is hard forking in May to remove the difficulty bomb.
31.05 Working prototype of Sidechain & Enable new Opcodes for compatibility with ETH
31.05 Radex will be the first decentralized exchange to be launched on ETC blockchain (BIG THING)
30.06 PoC of new StateDB layer & Emerald Mobile Wallet
13.07 At block height #6100000t. Each ETC holder receives ETE in the ratio of 1:1 for free (PRICE WILL DEFINITELY INCREASE)
31.07 Sidechains support in Emerald Project & Emerald SDK First Release
31.08 JIT Compilation in SputnikVM
30.11 Fully IoT-compatible infrastructure of ETC (BIG THING)
Thank you for all comments, likes and messages. Don't forget to follow us.
Huge hugs!
WBM Team
ETC bullish channelVery nice channel, looks like we found support at 0.236 fib level, i also noticed that etc is dipping on every bitcoin sell and bitcoin is just about to touch first support at $9200-$8800 (0.236 fib) so we may expect a bounce and further upward movments on both btc and etc vs btc. RSI and MACD very bullish. There is also a chance that bitcoin will drop below 0.236 fib level which is probly gona affect etc and we may fall out of the channel. If you guys want me to do a detailed bitcoin chart regarding what i just said let me know in the comments.


ETC BTCLong term resistance on the daily about to be tested, volume increasing nicely - Looking to reassess at 36sats - possible C&H formation
