ETCBTC trade ideas


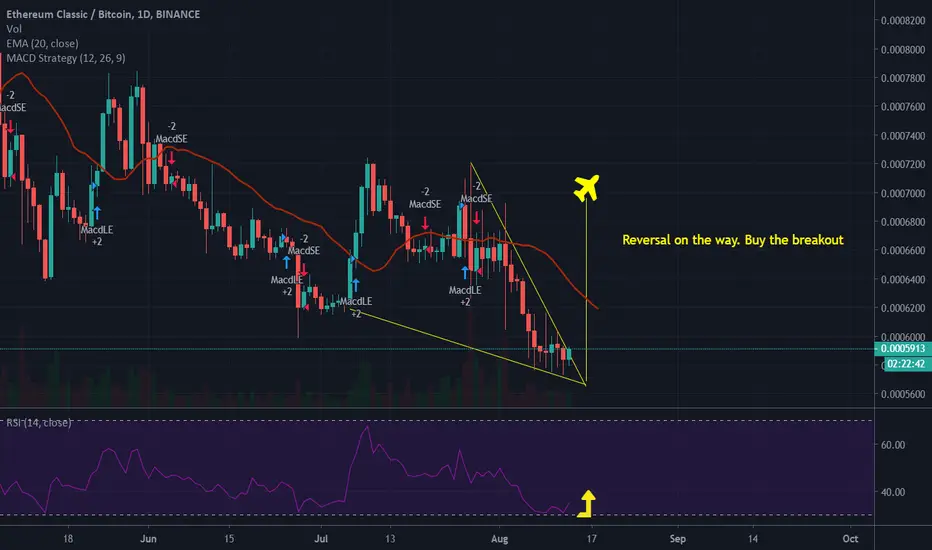

daily analysis of Ethereum classic/Bitcointhe daily chart of this market shows that it will experience a downward trend in the coming days but at the same time you have to be vigilant of the change of direction towards the opposite
please subscribe to receive more analysis
thank you

ETC/BTC (Target Key Support Below)ETC/BTC
-Ethereum Classic broke the local support at 6174 sat range
-The price started falling further, If we look at the chart
-We can see the Key support is located around 5000 area
-This zone will be crucial for the Bulls
-But will be another buying opportunity for potential strong bounce reaction
-Aggressive traders will start scaling in at 5000 area to hit a high reward trade
-While conservative traders will wait until the break of trendline resistance
-If you are a long term investor, I recommend buying at key support
-This will give you more buying power to load your bags :)


0.0006041 HOLDS ETCBTCIstanbul find new support on 0.0006041 and price is %-5 percent below ema-55.
The above references an opinion and is for information purposes only. It is not intended to be investment advice.


ETCBTC, The best Buy Zone!I show you the best buy zone above the Support/Resistance Zone.
If BTC will rise more we should pay attention to such levels.
Potential profit will be 3 times bigger than the risk.
Push like if you think this is a useful idea!
Before to trade my ideas make your own analysis.
Write your comments and questions here!
Thanks for your support!


ETC/BTCHuge potential upside on ETC/BTC is here. The coin has been testing the horizontal support zone for quite a while. It has also broken the downtrend line and resting it. Given the whole market is pumping right now, its hard to say ETC isn't going to have its turn.
Note: If you like the content and the setup, please give me a follow not to miss out on many altcoins charts to come.

ETC is looking for head and shoulders patternETC is going to retrace back after being rejected from weekly level on 1st test at 7252.
The candles followed three levels. ( Middle Trend Line, Bottom Trend Line and Monthly Horizontal Level).
The middle trend line acted as resistance throughout the downward trend, where as bottom trend line as well as at times monthly level acted as a support.
We can call bottom trend line and monthly level as DUAL SUPPORT for ETC.
Once Monthly support level broken on 07 may 2020, it became resistance, as on breaking monthly level candle has to find a support, which in this case was weekly support at 6383.
Current Condition
From 27 June 2020 to 05 July 2020, ETC was in accumulation zone, mean bullish move ahead was on cards, and it happened. During that bullish move, it broke the weekly level at 6383, and it had to find a new resistance which was the next weekly level at 7252.
ETC has found a new zone of support and resistance between two weekly levels, 7252 (Weekly Resistance) and (6383 Weekly support).
Weekly resistance and weekly support has been tested both for the first time, and right now we may see some retracement back to 7252 level.
If you want to enter the trade on daily candles, during the next week 10 to 12 percent rise is expected. You can trade long but must excite before 7252, as it can retrace back. making HEAD AND SHOULDERS PATTERN.
Lookout for Head and Shoulders pattern for now in coming 10 days.
Trade according to the pattern.


TRIPLING BTC WITH ETCHi everyone. I was searching for possible altcoin that i can invest and i saw that. I think it can go 3x with that price. Count on chart.
More than 14 R:R which is insane.
You SHOULD see what i did on LINK :
and also you SHOULD see how i call altparty before anyone else here;
Follow for more!

ETC/BTC strategyHello, traders.
ETC, we have an interesting situation happening with it, it broke its short-term downtrend but is now testing the key level as resistance (A key level is a place where the price was support and resistance many nos Last times)
The ideal would be for us to start an accumulation close to the resistance and as soon as we had the breakout we will be able to enter, we have a buying point in the resistance line to test as a pullback, above the key level we will be very bullish in the ETC
Push the like button and follow on tradingview.

ETC/BTC 1D (Binance) Descending channel & falling wedge breakoutFA: Ethereum Classic is a decentralized Proof Of Work coin and you can earn mining, but it will be a hybrid POW/POS (Proof Of Stake) system after ETH 2.0!
TA: ETC is on historic support, it should react with a bounce after that break-out confirmation of the wedge and go for mid-line channel at least.
Current Price= 0.0006671
Buy Entry= 0.0006606 - 0.0006263
Take Profit= 0.0007472 | 0.0008094 | 0.0009152
Stop Loss= 0.0005398
Risk/Reward= 1:1 | 1:1.6 | 1:2.62
Expected Profit=16.11% | 25.78% | 42.22%
Possible Loss= -16.11%
Fib. Retracement= 0.5 | 0.786 | 1.272
Margin Leverage= 1x | 3x | 5x
Estimated Gain-time= 1440h

