ETC- Critical zoneif this cryptocurrency fails to break out of the 60s, its doomed and that goes for most altcoins on their last legs of support.
I believe this is the correction we have all been waiting for.
manage risk accordingly!
ETCUSD trade ideas

Signs that show ETC has not peaked yet in this bull run.ETC has not reached out to its full 4.236 fib extension but in 2017 bull year we can see there was a massive knockback just before the last leg in the bull run.
In 2021 we're seeing very similar things with a even bigger knockback but seeing BTC's position in this market cycle it looks like the run is still not over.
ETC current corrective structure is very similar to the whole bear market of bitcoin from 2013 dec to 2015 jan .
There is a 7 wave corrective structure where 5th waves has 5 sub waves and 6th wave retraces to wave 4 within wave 5 before the Capitulation .
After the bottom was formed ,we can clearly see how btc came down near wave 7 before the start of the next rally which is quite similar in ETC chart right now.
Based on all this ,I see ETC going peaking around atleast 200usd.
However if ETC clears the 200-220usd and we see bitcoin around 50-60k ETC might head up for another massive rally which could extend upto 800usd by placing the 0.236 fib extension on the peak of 2017 bull run and bear market bottom.
ETC possible targets :
Target 1 : 205usd
Target 2 : 805usd (unlikely but possible)
#NFA

ETCUSD - 4H - Downtrend for completion of the current Primary 2Hello traders!
Short term trade for the current downtrend: completion of the current Minor Y (Red) which requires the completion of 3 legs down (ABC zigzag?) for the Minute Green Y.


Your ETC Trading Is Like Tapping Into A Gold Mine!Dear traders:
Ethereum Classic (ETC) is a newer (network) version (or a hard fork) of Ethereum (ETH) that launched in July 2016.
Save Little By Little.
Technical analysis section:
Based on breakout and DMI, seems ready to jump! Now, ETC is on my watchlist.
Bitcoin prediction:
(My long-term) Bitcoin analysis is attached.
ETC POSSIBLE long Targets - 3 targets ETC Broke UP out of a couple of patterns. (possible patterns) Smaller time frame Inverted Head & Shoulders, the Falling Wedge and the Triangle pattern. All 3 targets on chart. Cross up on Daily MACD. Targets could/most likely will take few days to hit. Probably coming back to retest trend line then Hopefully off to the races.

Ethereum Classic - Support BuyA previous resistance line on ETC has turned support
this is a good place to long ETC due to these conditions
A better buy would be along the green line if downward movement continues

ETCUSDT COULD BREAKOUT SOONETCUSDT could breakout anytime soon. If ETH reverse to uptrend, ETC breakout will be bullish.
Wait for candle confirmation before open position.
p.s not financial advisor

2500 usd PRICE TARGETAs you can see on the chart, the fib extension 2.61 is around $2,500 per ETC. I believe this price will be the end of the Bull market.
ETC was the last to peak during the wave 3, so the big question is wether ETC will be the last coin to peak or this time the order is different?
Thank you

ETC/USD (Test 1st Key Support Area)💎Technical Analysis Summary💎
ETC/USD
-After a strong move up last June 22 by almost 100% increase
-ETC failed to regain above the 50D Moving Average
-This Moving Average acted as a dynamic resistance zone
-Now, the price is retesting the support area number 1
-If we can see a strong bounce from here, I expect a retest of 50D MA again
-But if this support failed, the potential level to watch is the 200D Moving Average
-ETC is likely shifting to range-bound trading in the coming weeks
-So please be cautious buying at support or looking for a long term position
-Good luck traders! please manage your risk properly
⚠️Please always read the description⚠️
Thanks for donating 💰 via Tradingview coins bitcoinpam 🙏🎉
``````````````````````````````````````````````
If you need help🙋 don't hesitate to
Send me a message here PolarHusk 😊
``````````````````````````````````````````````
Trading Involves High Risk ⚠️
Not Financial Advice 💸
Exercise Proper Risk Management 💱
``````````````````````````````````````````````


Ethereum Classic (ETC) - July 15Hello?
Welcome, traders.
By "following", you can always get new information quickly.
Please also click "Like".
Have a good day.
-------------------------------------
(ETCUSD 1W Chart)
If the price is maintained above the 42.1-47.296 range, it is expected to create a new wave.
(1D chart)
It remains to be seen if the 37.180-47.947 zone can support and move up.
If the price is maintained in the 47.947-69.480 range, it is expected that the uptrend will continue.
If it goes down from the 37.180 point, there is a chance that it will fall below the 25.179 point, so you need to trade cautiously.
However, it may follow an uptrend line, so you should be prepared for this.
-------------------------------------
(ETHBTC 1W chart)
If the price maintains above the 0.040575-0.045 range, we expect the uptrend to continue.
(1D chart)
It remains to be seen if the 0.060306-0.065674 zone can find support and move up.
If the price holds above the 0.065674 point, it is expected that the uptrend will continue.
The 0.048795-0.053586 zone is an important support zone.
I think the big uptrend will most likely start with a break away from the downtrend line (1).
------------------------------------------
We recommend that you trade with your average unit price.
This is because, if the price is below your average unit price, whether it is in an uptrend or in a downtrend, there is a high possibility that you will not be able to get a big profit due to psychological burden.
The center of all trading starts with the average unit price at which you start trading.
If you ignore this, you may be trading in the wrong direction.
Therefore, it is important to find a way to lower the average unit price and adjust the proportion of the investment, ultimately allowing the funds corresponding to the profits to regenerate themselves.
------------------------------------------------------------ -----------------------------------------------------
** All indicators are lagging indicators.
Therefore, it is important to be aware that the indicator moves accordingly with the movement of price and volume.
However, for the sake of convenience, we are talking in reverse for the interpretation of the indicator.
** The wRSI_SR indicator is an indicator created by adding settings and options to the existing Stochastic RSI indicator.
Therefore, the interpretation is the same as the traditional Stochastic RSI indicator. (K, D line -> R, S line)
** The OBV indicator was re-created by applying a formula to the DepthHouse Trading indicator, an indicator disclosed by oh92. (Thanks for this.)
** See support, resistance, and abbreviation points.
** Support or resistance is based on the closing price of the 1D chart.
** All descriptions are for reference only and do not guarantee a profit or loss in investment.
Explanation of abbreviations displayed in the chart
R: A point or section of resistance that requires a response to preserve profits.
S-L: Stop Loss point or section
S: A point or section where you can buy to make a profit as a support point or section.
(Short-term Stop Loss can be said to be a point where profit and loss can be preserved or additional entry can be made through split trading. It is a short-term investment perspective.)
GAP refers to the difference in prices that occurred when the stock market, CME, and BAKKT exchanges were closed because they are not traded 24 hours a day.
G1 : Closing price when closed
G2: Opening price
(Example) Gap (G1-G2)

ETCUSD Breakout imminent 6/22 made the lows for the year, based on time cycle of low before run to 175, that has not been violated, trend likely to start swinging positive between 7/13 and 7/18, and we likely will not see these price levels again.

Etc!!Etc lost consildation support when it broke 48.5. It has a big area of support to watch at 45.7 however it could bounce and retest and reject at 48.3 and head further. This is the first area I am watching Howe ever losing and closing below 45.6 creating a further consildation could leave us headed to 42$ level or lower

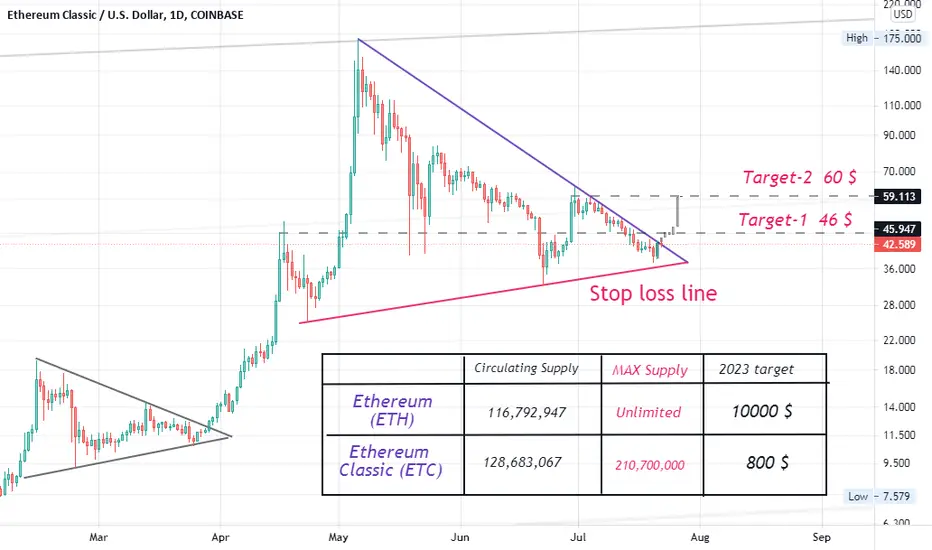
💥ETCUSD T0 PUMP BY 20% - 60% ($60 - $80)Please support this idea with a LIKE👍 if you find it useful🥳
Etherum classic broke out of a triangle and pump again into another triangle.😂
If you take a closer look at the chart, you will notice that price also has an inverse head and shoulder which gives a buy signal.
Therefore I expect price to break out this current triangle and pump to the neckline at $60.
Once price breaks the neckline, I expect a rise to $70, and $80.
What do you think?
Share your opinion in the comment section✍️
Happy Trading💰🥳🤗

ETC - Long - 4/1 RRPlaying the bullish 50 off the bearish harmonic - 4HR bullish divergence on the RSI... lets go!


Ethereum Classic - ETCUSDHello Traders
Ethereum Classic recently undergone a pump-and-dump and is currently hanging on a thread by our last major support zone.
If we close a daily candle BELOW this zone, I expect more downward pressure.
Check out my related video analysis below,
Trade Safe
Evelyn


Update
The Most Powerful Elliott Wave is wave 3.
Wave 3 coming. Warm hugs for ETC!
BTC is in Bullish (see attached idea).
Follow updates.


EtcJust noticed something on the daily here for etherum classic. Big support 100 ema on daily. Big resistance at 59.3 50 ema on daily. 21 ema daily is at 49.5 ish. So we def will see a big move one way or the other within the week!!! Keep an eye. Could be a great downside or up side money maker
