Ethereum Classic 2025 · 2 Months, 4 Months or 12 Months?Ethereum Classic is already on the other side, as you can see from this chart. 7-April 2025 was a turning point.
The correction developed from a high point in December 2024 and ended early April 2025. The day this correction ended, Ethereum Classic entered a new bullish cycle. This new bullish cycl
Related pairs

#ETC/USDT Might Be Good Zone to Bounce From#ETC
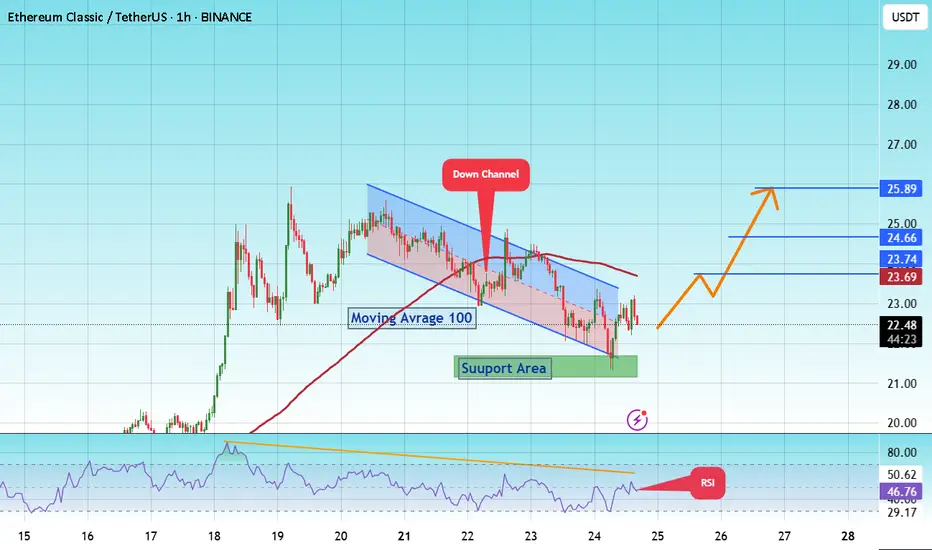
The price is moving within an ascending channel on the 1-hour frame, adhering well to it, and is on its way to breaking strongly upwards and retesting it.
We have support from the lower boundary of the ascending channel, at 19.61.
We have a downtrend on the RSI that is about to be broken and
a very nice r/r very nice return on etc which is the compliment to eth. as soon as eth breaks ath, etc will skyrocket right after.
low leverage for safety as these dinosaurs tend to be wickish

ETC 4H Analysis : V-Pattern Breakout , $23M Buy & Key Fib LevelsHey , how's it going? Come over here — Satoshi's got something for you !
⏱ We are analyzing Ethereum Classic (ETC) on the 4-hour timeframe .
👀 After breaking above the $19.1 level, Ethereum Classic started a strong and high-momentum bullish move and reached the $25.28 resistance, where it was reje

Ethereum (ETH): Might Be Good Zone to Bounce From ETC caught our attention with a local retest of the support zone, which, after a breakout, was a natural movement for the coin!
Now that we have been having that retest, we are looking closely for any signs of recovery, which would give us an opportunity to long from here.
While we see a smaller

ETCUSDT 1Dsalam tahlil etc o darim ke hame chiz moshakhase multi time frame mitoone trigger vorood bde . moraqebat konid by .

ETC/USDT 1D Chart1. Trend and price structure
• The price is currently 23.71 USDT (+6.75% on the day).
• After an earlier inheritance trend (yellow dotted line - trend line), you can see an attempt to break up and maintain above SMA 1 (approx. 22.30 USDT).
• The next resistance is 24.50 and 26.00 USDT - you ca

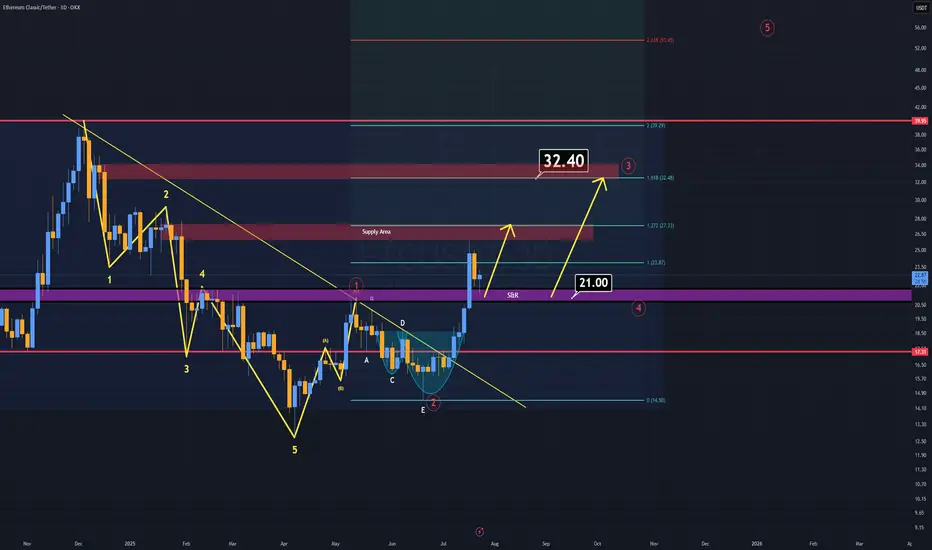
ETC Analysis (3D)ETC is showing a strong bullish structure, just like many other altcoins.
The key difference? ETC has already confirmed its breakout.
As long as ETC holds above the $21 level, I believe the minimum target sits at $32 in the coming weeks.
According to Elliott Wave Theory, that $32 region also marks
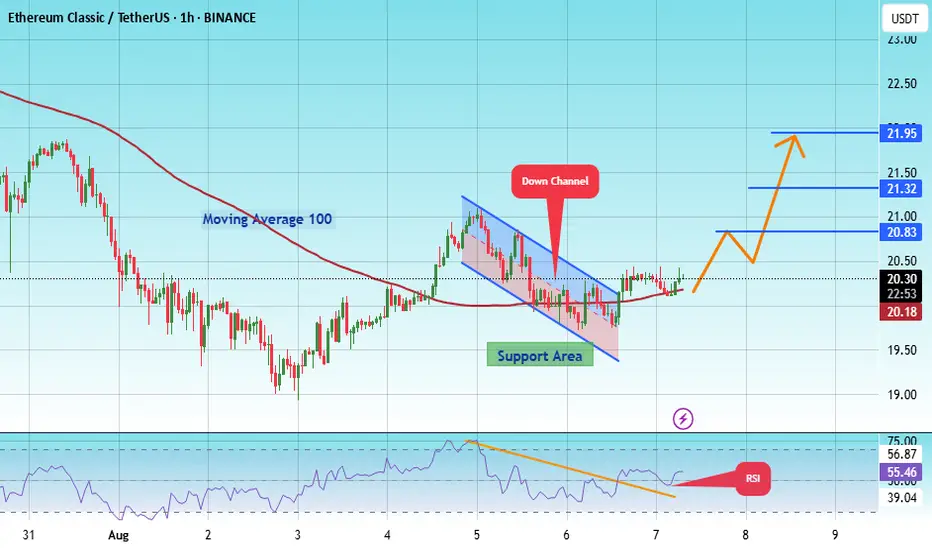
#ETC/USDT Forming Strong Bullish Potential#ETC
The price is moving within a descending channel on the 1-hour frame and is expected to break and continue upward.
We have a trend to stabilize above the 100 moving average once again.
We have a downtrend on the RSI indicator that supports the upward move with a breakout.
We have a support a
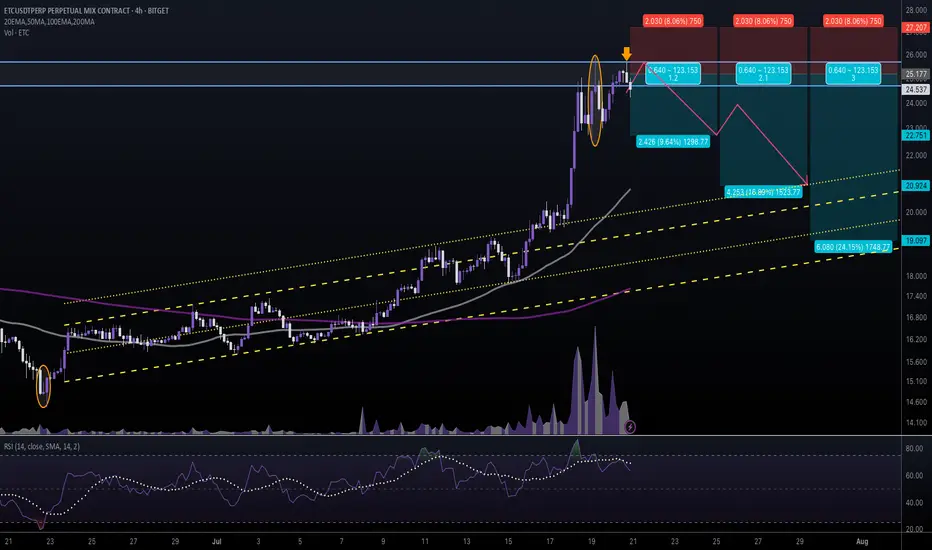
#ETCUSDT #4h (Bitget Futures) Ascending channel retestEthereum Classic printed two evening stars in a row, looks locally topped and ready for correction towards 50MA & 200MA supports.
⚡️⚡️ #ETC/USDT ⚡️⚡️
Exchanges: Bitget Futures
Signal Type: Regular (Short)
Leverage: Isolated (5.0X)
Amount: 5.0%
Entry Zone:
24.679 - 25.675
Take-Profit Targets:
1) 2
See all ideas
Summarizing what the indicators are suggesting.
Oscillators
Neutral
SellBuy
Strong sellStrong buy
Strong sellSellNeutralBuyStrong buy
Oscillators
Neutral
SellBuy
Strong sellStrong buy
Strong sellSellNeutralBuyStrong buy
Summary
Neutral
SellBuy
Strong sellStrong buy
Strong sellSellNeutralBuyStrong buy
Summary
Neutral
SellBuy
Strong sellStrong buy
Strong sellSellNeutralBuyStrong buy
Summary
Neutral
SellBuy
Strong sellStrong buy
Strong sellSellNeutralBuyStrong buy
Moving Averages
Neutral
SellBuy
Strong sellStrong buy
Strong sellSellNeutralBuyStrong buy
Moving Averages
Neutral
SellBuy
Strong sellStrong buy
Strong sellSellNeutralBuyStrong buy
Displays a symbol's price movements over previous years to identify recurring trends.
Frequently Asked Questions
The current price of ETCUSDT SPOT (ETC) is 23.83 USDT — it has risen 0.95% in the past 24 hours. Try placing this info into the context by checking out what coins are also gaining and losing at the moment and seeing ETC price chart.
ETCUSDT SPOT price has risen by 6.91% over the last week, its month performance shows a 23.59% increase, and as for the last year, ETCUSDT SPOT has increased by 29.37%. See more dynamics on ETC price chart.
Keep track of coins' changes with our Crypto Coins Heatmap.
Keep track of coins' changes with our Crypto Coins Heatmap.
ETCUSDT SPOT (ETC) reached its highest price on Mar 29, 2022 — it amounted to 52.51 USDT. Find more insights on the ETC price chart.
See the list of crypto gainers and choose what best fits your strategy.
See the list of crypto gainers and choose what best fits your strategy.
ETCUSDT SPOT (ETC) reached the lowest price of 12.48 USDT on Jun 18, 2022. View more ETCUSDT SPOT dynamics on the price chart.
See the list of crypto losers to find unexpected opportunities.
See the list of crypto losers to find unexpected opportunities.
The safest choice when buying ETC is to go to a well-known crypto exchange. Some of the popular names are Binance, Coinbase, Kraken. But you'll have to find a reliable broker and create an account first. You can trade ETC right from TradingView charts — just choose a broker and connect to your account.
Crypto markets are famous for their volatility, so one should study all the available stats before adding crypto assets to their portfolio. Very often it's technical analysis that comes in handy. We prepared technical ratings for ETCUSDT SPOT (ETC): today its technical analysis shows the strong buy signal, and according to the 1 week rating ETC shows the buy signal. And you'd better dig deeper and study 1 month rating too — it's buy. Find inspiration in ETCUSDT SPOT trading ideas and keep track of what's moving crypto markets with our crypto news feed.
ETCUSDT SPOT (ETC) is just as reliable as any other crypto asset — this corner of the world market is highly volatile. Today, for instance, ETCUSDT SPOT is estimated as 9.27% volatile. The only thing it means is that you must prepare and examine all available information before making a decision. And if you're not sure about ETCUSDT SPOT, you can find more inspiration in our curated watchlists.
You can discuss ETCUSDT SPOT (ETC) with other users in our public chats, Minds or in the comments to Ideas.