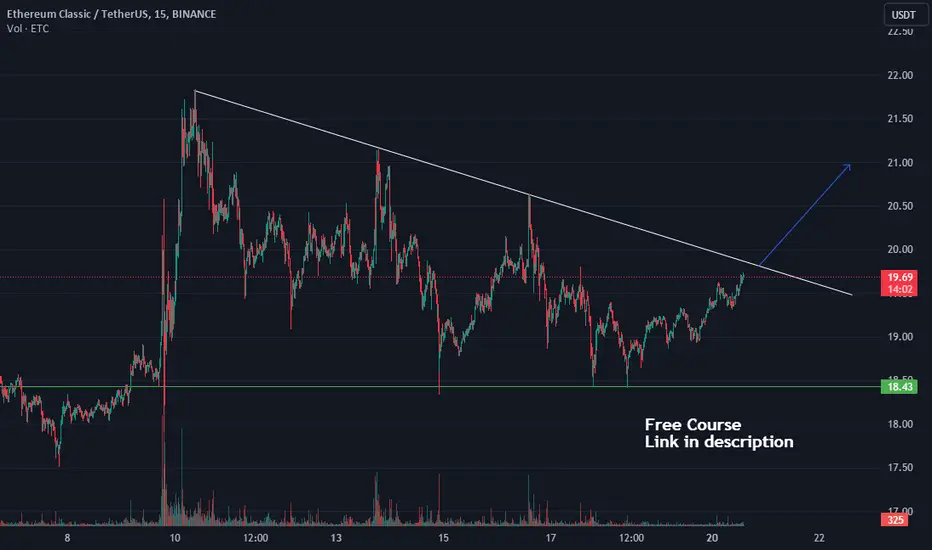
I see, I post on tradingview, I wait, I enter. $ETCWas waiting for a bounce, and here it is. Starting a long now.
ETCUSDT trade ideas

ETC/USDT analysis update from 11/13/2023Hello everyone, I invite you to check out the updates on previously performed ETC/USDT analyses. Let's start by marking the formation we can see, currently we have one channel created, when a second smaller one is created, it may be the beginning of a pro-growth formation. Next, the white line will mark the local trend line over which we are moving, and the yellow line will mark the downward trend from which the price moved dynamically into a local uptrend.
Going further, we can move on to marking support areas when we start a correction. And here we will mark the support zone from $19.55 to $18.12, but if the price breaks out of it, we may see a return to the second zone from $15.78 to $14.11.
Looking the other way, we see that the price is fighting in a strong resistance zone from $20.20 to $22, and then we have visible resistance at $24.31.
Please look at the CHOP index, which indicates that we have energy for the upcoming move, the RSI indicator shows an upward movement after recovery, which again gives a lot of room for a decline, while the STOCH indicator shows that the upper limit has been exceeded, which causes the growth to slow down and may translate into for the price recovery.
As we can check, the analysis performed earlier works very well, we can see the downward movement as announced and we are currently moving in the previously indicated support zone, let's continue to observe whether the principle of the mentioned formation will work.

ETC in a pro-growth formation?Hello everyone, I invite you to review the ETC chart in pair with USDT, also on a four-hour interval. Let's start by marking the formation we can see, currently we have one channel created, when a second smaller one is created, it may be the beginning of a pro-growth formation. Next, the white line will mark the local trend line over which we are moving, and the yellow line will mark a downward trend from which the price moved dynamically into a local upward trend.
Going further, we can move on to marking support areas when we start a correction. And here we will mark the support zone from $19.55 to $18.12, but if the price breaks out of it, we may see a return to the area of the second zone from $15.78 to $14.11.
Looking the other way, we see that the price is fighting in a strong resistance zone from $20.20 to $22, and then we have visible resistance at $24.31.
Please look at the CHOP index, which indicates that we have energy for the upcoming move, the RSI indicator shows an upward movement after recovery, which again gives a lot of room for a decline, while the STOCH indicator shows that the upper limit has been exceeded, which causes the growth to slow down and may translate into for the price recovery.

ETHEREUM CLASSIC SPOTEthereum classic has potential to go upside , reason behind that is break of trendline and retest , it will be good buying in spot, accumulate some etc and do dca according to your portfolio

Big Move For ETCI'm currently in a long from $14.57
My first Take Profit is $35
Finally Take Profit is $94


ETC looking for a bounce?Wait and see... If it bounces of the resistance level I'm longing this thing. Wouldn't enter yet though.

ETC: Building Momentum to Break Descending Channel 🚀ETC's Journey Toward Breaking the Descending Channel:
Prolonged Descending Channel: Since October, ETC has been confined within a descending channel, reflecting a prolonged period of downward movement.
Building Bullish Momentum: The current market dynamics reveal a notable compression occurring under the upper boundary of the descending channel, suggesting a gathering of bullish momentum.
Key Observations:
Channel Exit Anticipation: Traders and investors are keenly observing ETC as it approaches the upper boundary of the descending channel, anticipating a potential breakout.
Bullish Sentiment: The compression under the upper boundary implies a shift in sentiment, with bulls gaining strength and preparing for a possible upward move.
Potential Implications:
Bullish Breakout Scenario: If ETC successfully breaks out above the upper boundary of the descending channel, it could mark the end of the extended bearish phase and signal a new bullish trend.
Target Levels: Traders will be eyeing key resistance levels beyond the channel exit for potential targets as ETC strives to establish a new upward trajectory.
Trading Strategy:
Confirmation and Entry: Wait for a confirmed breakout above the upper channel boundary before considering entry, ensuring it aligns with supporting volume and price action.
Risk Management: Employ risk management tools, such as stop-loss orders, to mitigate potential downside risks and protect trading capital.
Conclusion:
As Ethereum Classic approaches the upper boundary of its longstanding descending channel, the compression suggests a shift in market sentiment. Traders are on the lookout for a potential breakout, which could signal the beginning of a new bullish phase for ETC.
Wishing you successful trades as we monitor ETC's journey toward potential channel exit!
❗️Get my 3 crypto trading indicators for FREE! Link below🔑

ETC is +173% profit in the long run.Hi everyone, it's time to talk about ETC.
For more than a year the asset has been in a large accumulation zone and the stopping factor for the price growth was the 200 day EMA and the descending trendline, which is one of the facets of a symmetrical triangle/descending triangle.
The price recently managed to consolidate above the EMA-200 but further growth was stopped by the downtrend line.
The price range is now maximally narrowed and on the background of the changed general market trend I expect a breakdown of the downtrend line and further movement to the important Fibo level of 0.236.
I plan to open positions also from 0.236 Fibo level.
Targets on the chart: 0.382 Fibo (+45%) 0.5 Fibo (+99%) and 0.618 Fibo (+173%).
Additionally on the chart I marked the price resistance/support levels with blue lines.
In the long term, we can expect an ATH update on the chart.
Also, if you have extra funds, you can place buy orders around $14-$16
This is not financial advice, everything you do you do at your own risk!

ETC - Classically moving up.ETC has been in accumulation and now has started forming bullish structures.
I am seeing a move to 22$ and if the resistance in that zone is broken price is probably reaching 28$ and higher.
Lets see.

ETC/USDT shows signs of strength for a potential breakout.I anticipate the price to breach the trendline resistance, possibly resulting in a 15-30% upward movement in the short term. Let's monitor closely.
This idea is for educational purposes only and not financial advice. Always conduct your research before making any trading decisions.

ETC target 2612h time frame
-
ETC is breaking and retesting the bottom triangle and getting support at 0.5 Fibonacci Retracement. Considering the symmetrical structure and previous highs, there are lots resistance zones which will provide pressure for price. However, we can still set a trading plan woth good risk to reward ratio here.
TP: 26 / 38
SL: 17.295

ETC/USDT bull Flag Breakout Anticipated? 👀 🚀ETC Today Analysis💎Paradisers, prepare for a remarkable opportunity with #ETCUSDT. It's currently exhibiting a promising pattern, nearing a breakout from a bull flag formation, which signals a high probability of an upward move following this potential breakout.
💎#EthereumClassic has been following a descending trendline trajectory. After breaking above, it has formed a bull flag, indicating a bullish sentiment. Presently, as it trades in a demand zone, there's a substantial chance for a bullish movement. With continued upward momentum, It is set to target supply levels at $21.81, and could potentially extend its rise to challenge higher supply levels at $24.91.
💎 Additionally, be ready for a possible bullish resurgence from the demand level of $17.89 if #ETC encounters difficulties in sustaining its upward trajectory. However, a drop below this level could signify potential challenges in sustaining the bullish trend.
💎 In this dynamic and evolving market environment, strategic foresight and skilled decision-making are crucial. Developing a comprehensive trading strategy, which includes prudent money management and a thorough understanding of support and resistance levels, is key to achieving successful trading outcomes. 🌴💰

ETC/USDT Next Potential Move |🚀👀 Bullish or Bearish?💎 Paradisers, gear up for a promising trading opportunity with ETCUSDT. It's showing significant activity in the demand zone, which might signal a shift towards an upward trend.
💎 Ethereum Classic has been consistently following a trading channel pattern. Having already broken above this channel, we expect it to move towards a resistance level, followed by a prompt pullback, maintaining its established pattern.
💎 There's a high probability of a bullish trend initiating from the support level at around $16.79. With ETC having effectively exited the trading channel upwards, it's poised to challenge resistance levels near $26.
💎 Precise timing is crucial for the discerning Paradisers. Pinpointing the optimal entry points during this rising phase is essential, and it's advisable to avoid entering at the peak of the movement.
💎 Caution is warranted, as there's a possibility of ETC falling below the $16.79 support level. A drop below this pivotal mark might lead to doubts about the potential for a sustained upward trend.

ETCUSDT BULLISH POTENTIALMarket already ranging for few month, today i see there is potential price rising, it start to create bull flag at lower timeframe, im expecting an upward movement to 30 USD in next few weeks.

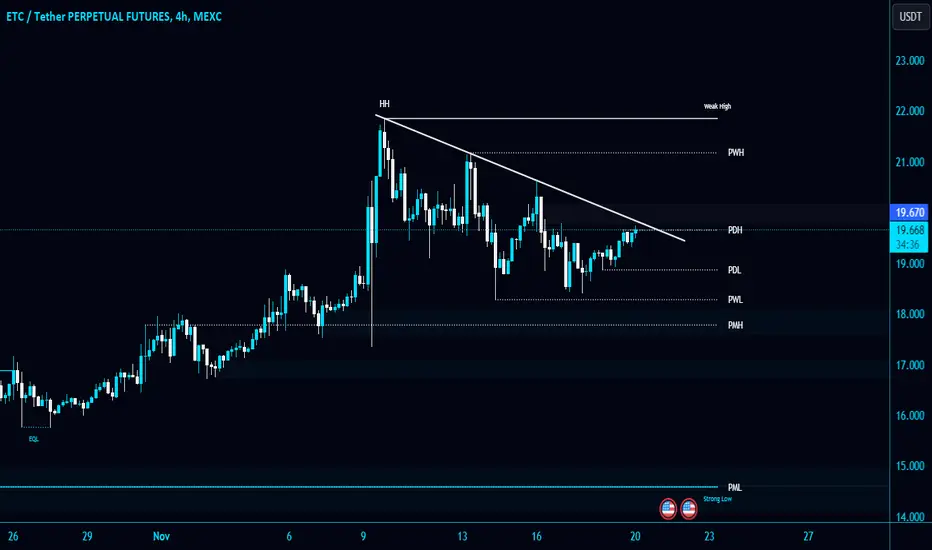
#ETC/USDT is testing the PDH $19.66 and Diagonal Trendline#ETC/USDT is testing the PDH $19.66 and Diagonal Trendline in 4-Hour TF!
BME:ETC needs to clear the Trendline and resistance level to gain the bullish momentum. Wait for BO/retest to open a long position.
ETC prepair for break local downtrendGlobally trading in an uptrend, the asset has formed a downtrend.
The fourth touch was formed, after the impulse growth, the volumes fall, which indicates that a large player is gaining a position.
ETC Descending Triangle Signals Upside PotentialETC is currently shaping a descending triangle pattern, presenting a potential opportunity for strategic positioning ahead of a potential upward move. The descending triangle is a key technical formation that often precedes a breakout, with traders closely monitoring the pattern's evolution. As ETC shows signs of consolidation within this structure, market participants are strategizing for possible bullish momentum. Stay tuned as Ethereum Classic unfolds, offering a prospect for a positive shift in its price trajectory.

Trend breakoutAn downward trend breakout is dedected. I will looking for an retest for a long antery.

ETC 👉 ASCENDING TRIANGLE 👈Hi dear traders
The price is moving inside the ascending triangle
If the support area of 14$ is maintained and the downtrend line is properly broken, we expect the price to reach the specified targets.
Let's see what happens
This is not financial advice ( DYOR )
Good luck

ETCUSDT Looks like it will fly very soon27$, 43$, 75$ and more...
The first months of 2024 will be truly exciting; let's see what is going to happen

ETC/USDT potential shift ? 👀 🚀 ETC Today Analysis💎 Paradisers, be alert! We've observed that ETCUSDT, amidst recent market fluctuations, is revisiting a robust support level, hinting at a potential bullish trajectory.
💎 After a swift descent, ETC touched upon its daily support. This came post its ascent above the channel, charting an upward path. However, a rejection from the overhead supply, coupled with the formation of an equal high, triggered a significant decline.
💎 Now, if the price sustains its momentum above the 14.53 support mark, we're hopeful of it targeting the upper supply zone.On the flip side, should the price of ethereumclassic dip below this support, anticipate a deeper descent.
💎 Remember to employ prudent trading strategies and use proper stop-loss measures! Stay alert to market movements and look forward to more insights

✴️ Ethereum Classic Next Target Too High To Show ($7,545???)Ethereum Classic's next target is way too high to show here, literally off the chart.
I feel timid when I am about to share these numbers... What if it doesn't' hit?
How are people going to react?
Will they kill me in the comments for writing such outrages things?
Honestly, I do not care.
Bear with me for a few minutes... We are not done.
I use the charts and the tools we have here at our disposal in order to make some projections, they can be right just as they can be wrong.
The biggest mistake always has been underestimating the market, never have we overestimated Crypto, never before... I don't think we are about to start now.
✔️ If we get it right... Great, that's fine.
✔️ If we get it wrong, it is because the target was not high enough.
👉 One can say the next All-Time High sits at $282 but the Ethereum Classic (ETCUSDT) goes higher and higher and higher and hits $468 !
See what I mean?
It is all done for your entertainment.
Namaste.
