✴️ Ethereum Classic, The Bigger Picture ($118 - $289 Long-Term)We looked at many Altcoins in the short-term... Let's expand our view, let's see what the long-term chart has to say, the perspective widens, it is completely different.
Here we have many bullish signals, really strong, for Ethereum Classic (ETCUSDT).
Let's start from right to left:
We have a volume breakout with the highest weekly buy volume since August 2022.
This week ETCUSDT is moving above EMA21 and EMA10. Strong signal.
The RSI is super strong at 53.86, again, weekly, which means 7X stronger than the daily.
The consolidation triangle is being broken bullish. This same pattern in 2021 led to a very strong bull-market.
Long-term higher lows. Long-term growth. Long-term up.
The targets goes as follow once the bull-market starts:
1) $37 can be achieved easily on the first jump wave.
2) $52 follows and $77 mid-term.
3) The long-term targets go to $118 and $146.
4) The new All-Time High, over a year from now, can hit $289 or higher... We will look at the higher potential in the future.
That's Ethereum Classic for you long-term.
Namaste.
ETCUSDT trade ideas

Ethereum Classic ETC price remembered that it can growOver the past week, many "old" altcoins have mentioned that in addition to the ability to "constantly fall", there is another function - "price growth"
Recently, we have been updated many ideas for coins and have shown good growth: BCHUSDT, LTCUSDT, SOLUSDT, COMPUSDT and others, which can be found in our profile, and today we will talk about ETCUSDT
Buyers ETC need to make one more upward impulse for the ETC price to finally break through the first echelon of sellers' defense.
Above $24-25, there is a major cluster of shorts' stop orders, breaking through which the ETCUSD price can easily reach $26.50
And after this we will have to see which scenario the Ethereum Classic price will follow: the red or blue scenario.
_____________________
Did you like our analysis? Leave a comment, like, and follow to get more

Entry after breaking blue rangeIn this analysis, we examined the Ethereum Classic digital currency. This analysis is in daily time.
Due to the failure of the downward trend in the daily time, there is a 100% chance of growth for this currency, but as you can see, it is better to wait until the safe entry point because there is a strong resistance.

ETC target 3812h time frame
-
ETC is still under the downtrend so far.
The best entry is wait for breakout and retest the structure.
TP: 38
SL: 16.8

Ethereum Classic to rally toward $21 soonThe H4 market structure was bearish, with the blue line highlighting the bearish MSB. However, the previous move upward that shifted the trend bullish was used to plot a set of Fibonacci retracement levels.
They showed the 50% retracement level at $17.06- a level that was tested a few hours earlier. It offered a good R:R opportunity to long, with invalidation below the 61.8% level.
Traders can re-evaluate the market in case prices drop below $16.43
Entry: $17.31
Stop-loss: $16.28
Take-Profit: $21
R:R: 3.58

ETC/USDT ANALYSISOn daily price been rejecting that level,
For continuation we need a push above
21.150->hold->consolidate = next leg up
Else a filthy rejection again to 19.150

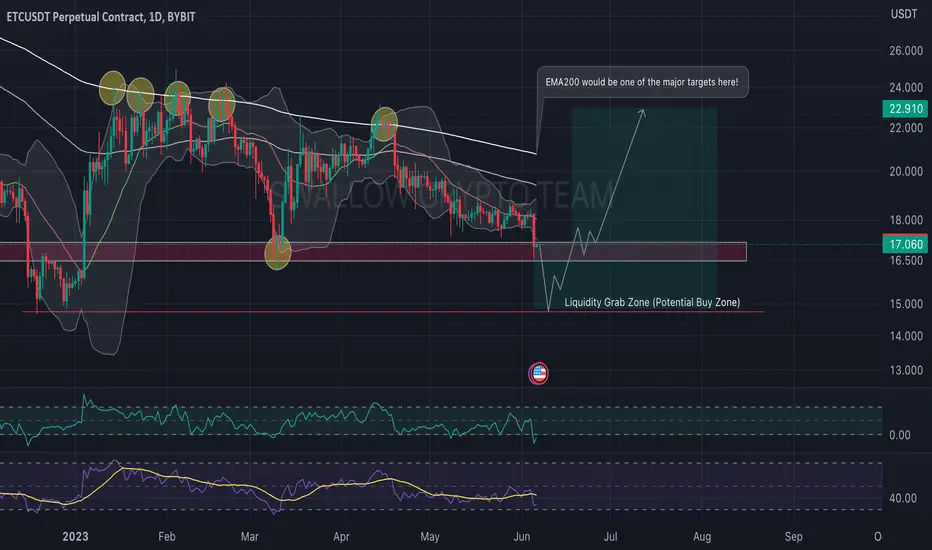
ETC/USDT looking for good entry hereHey traders 👋
ETC/USDT is next pair on our watchlist which is still looking for a support to settle the price upon. We are looking more at that Liquidity grab zone here which seems to the major zone for price to touch here this week. We need a confirmation of breaking the current support and once we get the breakdown we will most likely head towards $14.700.
If you like ideas provided by our team you can show us your support by liking and commenting.
Yours Sincerely,
Swallow Team
Disclamer:
We are not financial advisors. The content that we share on this website are for educational purposes and are our own personal opinions.
ETC/USDT - Potential Trading Setup! Hey traders 👋
Next one on our watchlist is ETC coin where we see the price inside the triangle formation! We are waiting here for that 4th touch on that upper line from where we are going to look for a short position with a probability to hit those lower zones of $17 and $15. Keeping an eye here!
If you like ideas provided by our team you can show us your support by liking and commenting.
Yours Sincerely,
Swallow Team
Disclamer:
We are not financial advisors. The content that we share on this website are for educational purposes and are our own personal opinions.


etcNow it is in a daily resistance, which goes up and down. If it breaks, the ceiling of the channel and high numbers, which takes time.

ETC USDT PERP Hello Trader BINANCE:ETCUSDT.P
the area is classified as sideways bearish for a separate ETC on the 1-hour time frame, still stuck for long orders. I suggest to short positions from now on because most likely the area won't be able to penetrate because the btc has increased significantly tonight
Please add a comment and Positive feedback and
constructive criticism are important to authors and the
community.
Disclamer: Not Financial Advice

ETC - breakdown of the global countertrend! The price will fly iHello trader! Today I have a new idea for you. Like and subscribe to the channel, there is a lot of useful information.✅
A few thoughts regarding the ETC chart.
My position at 15% of the deposit with an entry point of $18.85 continues to hang, as I said, I will just wait for better changes in altcoins. Well, according to ETC, they may have already arrived ...
Technical: the price has broken the global trend line and the most important thing is that the buyer does not lose the zone and we are fixing above this trend line.
In the future, if things go well on the chart as well, then I expect to see an exit to the first resistance of 0.236 Fibonacci ($23-25) 25% of my entry point.


How many chances do you think Ethereum Classic will give you?
Ethereum Classic (ETC) is not a security under existing United States laws. I wonder what you do!!!
Full List of Cryptos Named Securities in SEC Lawsuits:
www.sec.gov
Cosmos (ATOM)
Binance Coin (BNB)
Binance USD (BUSD)
COTI (COTI)
Chiliz (CHZ)
Near (NEAR)
Flow (FLOW)
Internet Computer (ICP)
Voyager Token (VGX)
Dash (DASH)
Nexo (NEXO)
Solana (SOL)
Cardano (ADA)
Polygon (MATIC)
Filecoin (FIL)
The Sandbox (SAND)
Decentraland (MANA)
Algorand (ALGO)
Axie Infinity (AXS)
Ripple (XRP)
Telegram’s Gram (TON)
LBRY Credits (LBC)
OmiseGo (OMG)
DASH (DASH)
Algorand (ALGO)
Naga (NGC)
Monolith (TKN)
IHT Real Estate (IHT)
Power Ledger (POWR)
Kromatica (KROM)
DFX Finance (DFX)
Amp (AMP)
Rally (RLY)
Rari Governance Token (RGT)
DerivaDAO (DDX)
XYO Network (XYO)
Liechtenstein Cryptoasset Exchange (LCX)
Kin (KIN)
Salt Lending (SALT)
Beaxy Token (BXY)
DragonChain (DRGN)
Tron (TRX)
BitTorrent (BTT)
Terra USD (UST)
Luna (LUNA)
Mirror Protocol (MIR)
Mango (MNGO)
Ducat (DUCAT)
Locke (LOCKE)
EthereumMax (EMAX)
Hydro (HYDRO)
BitConnect (BCC)
Meta 1 Coin (META1)
Filecoin (FIL)
Binance Coin (BNB)
Binance USD (BUSD)
Solana (SOL)
Cardano (ADA)
Polygon (MATIC)
Cosmos (ATOM)
The Sandbox (SAND)
Decentraland (MANA)
Axie Infinity (AXS)
COTI (COTI)
Paragon (PRG)
AirToken (AIR)
Chiliz (CHZ)
Flow (FLOW)
Internet Computer (ICP)
Near (NEAR)
Voyager Token (VGX)
Nexo (NEXO)
Mirrored Apple Inc. (mAAPL)
Mirrored Amazon.com, Inc. (mAMZN)
Mirrored Alibaba Group Holding Limited (mBABA)
Mirrored Alphabet Inc. (mGOOGL)
Mirrored Microsoft Corporation (mMSFT)
Mirrored Netflix, Inc. (mNFLX)
Mirrored Tesla, Inc. (mTSLA)
Mirrored Twitter Inc. (mTWTR)
Mirrored iShares Gold Trust (mIAU)
Mirrored Invesco QQQ Trust (mQQQ)
Mirrored iShares Silver Trust (mSLV)
Mirrored United States Oil Fund, LP (mUSO),
Mirrored ProShares VIX Short-Term Futures ETF (mVIXY)

Etc Looks Solid For Massive recovery Seems Like Getting ready For Massive Bullish Wave Formed Symmetrical Triangle In Midterm incase Of Breakout expecting 350%+ Bullish Wave In Midterm

ETCUSD ❕ downward channelETC is moving in a downward channel.
Price is testing 200EMA as resistance (4H TF)
I think the asset will continue to decline.

ETCUSDTGreetings According to my research, Ethereum Classic has hit a strong support zone, which has higher potential and can grow from this zone to the $18 area.

Possible mega pump on ETC/USDTETC maintains a monthly uptrend, but it is also compressed by a monthly downtrend that is about to be broken and we will see a possible pump. It also has a strong monthly support, and a critical resistance would be around the price of $38.70.

ETC/usdt 1wThis is a classic Ethereum chart on a weekly time frame. Take the prices in the photo seriously, they are suitable for purchase and maintenance

ETC/USDT looking for short here! Hey traders 👋
ETC coin had a nice fall from where we expect the price to show some recovery (Short term). We are looking here for price to reach $16-$17.5 zone from where we want to see another dump of at least 10-15%. Let's wait and see how price will move from here on!
If you like ideas provided by our team you can show us your support by liking and commenting.
Yours Sincerely,
Swallow Team
Disclamer:
We are not financial advisors. The content that we share on this website are for educational purposes and are our own personal opinions.

ETCUSDThey traders
check the chart and lvls
what u think ?
is this the time ? or its not enough for bulls ?
i can see some sweet bears behind this lvl
share ur chart and leave a comment
