Etc now we can see easily bearish momentem ,Etc is a very good project of crypto and etc now available for a mining. I think this crypto currency is the one the best fundamental coin for future , we can see easily now etc us bearish momentem in some High time frame we can see price easily 13.5$to 14$ and and I think this is the bottom off etc but 14$ to 10$ range a very good for a etc he quickly recover for crash may be can be see double bottom on 13to 14$ then price break a one + year downing fall channel ,then etc go to moon , etc add your portfolio
ETCUSDT trade ideas

✅TS ❕ ETCUSD: going up✅✅ ETC is going up.
This is a correction.
I expect growth to resistance.✅
🚀 BUY scenario : long to 24.32.🚀
----------------------------------------------------------------------------
Remember, there is no place for luck in trading - only strategy!
Thanks for the likes and comments.

ETC BULLISH FLAG 🤓🚩🤓🚩🤓🚩Hi dear traders
ETC has formed a bullish flag🏁 pattern.
In the daily time, bullish divergence is seen.
I expect the price to rise to the bottom of the ascending channel.
You can wait for the approval of the template to enter.
EMA20 plays the role of resistance, it must pass through this resistance to climb.
All targets specified.
Let's see what happens
This is not financial advice ( DYOR )
Good luck

✅TS ❕ ETCUSD: bounced off✅✅ ETC bounced off the support level.
The price went up.
A correction is possible, after which growth is expected.✅
🚀 BUY scenario : long to 24.32.🚀
----------------------------------------------------------------------------
Remember, there is no place for luck in trading - only strategy!
Thanks for the likes and comments.

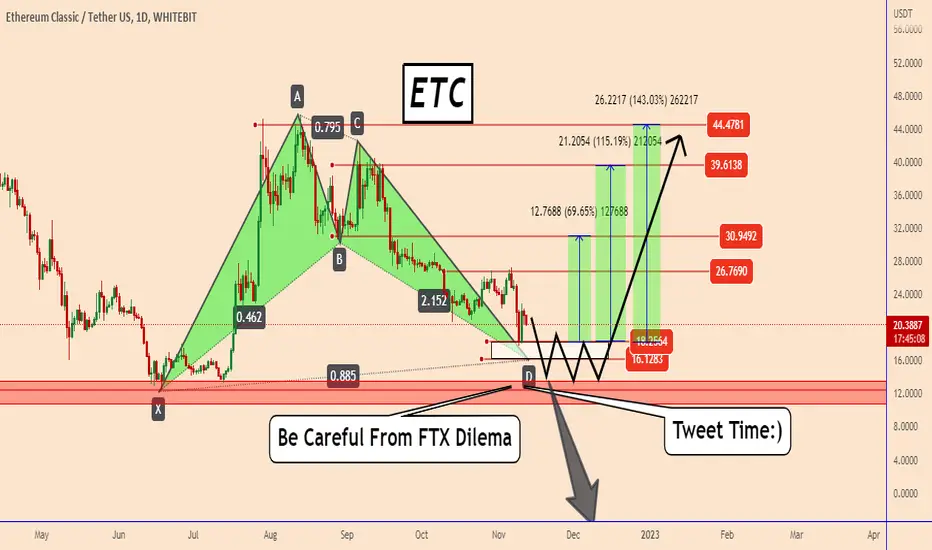
ETC: We Can never Know When The Next TWEET Will Come...ETC: We Can never Know When The Next Tweet Will Come...
I am neither bullish nor bearish during these moments for the crypto market. The current problem with FTX has already created a huge mess in the entire crypto industry and now everyone is expecting the worst.
However, we can't be only bearish just because of the news, and we can't be bullish too. Sometimes it is also better to wait until everything calms down and later you can execute your trading plan.
You might think why are you still positive?
Was it the CEO of Binance who with one TWEET dumped the market and it was his TWEET again that pumped/dumped the whole market?
So we can never know when the next Tweet will come...
PS: This setup is not ready yet...we have to wait to trade it once the FTX issue is fully resolved,
Thank you and good luck.
ETC POSSIBLE H&S formation! Nothing changes after this crash!After the crash of the market bacause of Alameda and FTX I rebild the drawings and the possible figure it's even more beautiful!

ETCUSDTHello traders ,what do you think about ETCUSDT? It is in a low-risk position to buy .You can enter a buying position with a SL below the specified range
If this post was useful to you, do not forget to like and comment.❤️

🔥 ETC Can Fall Much More: Capitulation AnalysisAround two months ago I made an analysis on ETC and the bearish price action I was expecting. It took a while, but over the last two days my last target has been hit.
I think we can potentially fall much further. First target at $14. If things really get out of hand we might even fall to $10, see the dotted bottom support.

Ichimoku Analysis for ETCShorted $ETC here with a sl of 31 as we got a price and lagging both below the kumo cloud.

Trading opportunity for ETCUSDTBased on technical factors there is a Short position in :
📊 ETCUSDT
🔴 Short Now 20.52
🧯 Stop loss 22.52
🏹 Target 1 17.00
🏹 Target 2 13.50
🏹 Target 3 10.30
💸RISK : 1%
We hope it is profitable for you ❤️
Please support our activity with your likes👍 and comments📝

ETCUSDT Prospects for Ethereum classic price movements in futureBefore you is the global graph of the ETCUSDT trading pair
After the rapid growth of the ETC price in 2021 by +3700%, since May 2021 the price has been in a downtrend for more than a year.
The correction of the ETCUSD price from the maximum value of $179 was -93%
It seems that during June-July 2022 the bottom and the completion of the correction and after a powerful shot of the ETCUSDT price upwards by 111% was formed
It is very likely that the banal, ETCUSDT price flew up so rapidly following the price of its expensive fork - ETH (this project is over saturated with promising news in the future)
By the way, here our a global idea for ETHUSDT, which works well.
So, after such a rapid growth, a price correction is needed.
Buy zone where the ETC price can roll back - $18.40-21.40
That is, strong cryptocurrency market = weak correction = $21.40
Again, negative in the cryptocurrency market = deep correction = $18.40 or even lower.
The target from above for the next strong wave of growth is in the area of $44
_______________________________
Since 2016 , we have been analyzing and trading the cryptocurrency market.
We transform our knowledge, trading moods and experience into ideas. Each "like under the idea" boosts the level of our happiness by 0.05%. If we help you to be calmer and richer — help us to be happier :)

ETC LongDaily MS Shifted to bullish. price reclaimed a very strong S/R zone. I would long the retracement to the golden pocket and the daily OB breaker. anywhere between 22.37-23.37 is a good long. stop below the low

ETCUSDT (2H) VWAP StrategyThe information contained herein has been prepared for general information purposes only. The comments and recommendations contained herein are based on the personal opinions of commenters and recommenders. It should not be interpreted as a buy-sell recommendation or a promise of return on any investment instrument. These views may not be suitable for your financial situation and risk and return preferences. Therefore, making an investment decision based solely on the information contained herein may not yield results that meet your expectations.

ETC SHORTAfter the rapid trend, ETCUSD is now in static support and the Fibonacci golden zone of 0.618, but it has undergone a sharp correction. I think it cannot break the downward trend and descend to the lower levels
ETCUSDT Support Range And 3 Resistance Levels UpdateAs you can see, after the price hits the 61.8 level and this level becomes a support, you can see how beautifully this level appears in its role and supports the price, and the price goes up to the next resistance, but it cannot Keep it and it will decrease.

ETC BIG LONGWeakening of the downtrend in daily time
A positive divergence in valid timeframes as well as a bullish condition of the entire crypto market index creates an entry signal.

ETC/USDT - LONG SCALPING-- Support me with numbers and follow up on my account for other deals in the future. Thank you for coming to this part. --
-------------------------------------------------------
⚡️⚡️ ETC/USDT ⚡️⚡️
Exchange: ByBit USDT
Trade Type: Breakout (Long)
Leverage: Cross (5.0X)
Entry Orders:
1) 24.71 - 100.0%
Take-Profit Orders:
1) 25.435 - 60.0%
2) 25.925 - 15.0%
3) 26.56 - 15.0%
4) 27.525 - 10.0%
Stop-loss Orders:
1) 23.35 - 100.0%
Trailing Configuration:
Stop: Breakeven -
Trigger: Target (1)

ETCUSDT Support Range And 3 Resistance LevelsThe support range and 3 resistances are drawn in front of the symbol in the chart.

ETC POSSIBLE H&S formation!With the uncertanty in the markets some ALTCOINS are experiencing a pretty good growth!
Here an idea of a POSSIBLE Inverted Head & Shoulders formation with the explanation of the growth! The figure is not formed still and we need to see the complete formation of the right shoulder!

LONG ETCETC on local Support Good for Long
Daily MS Shifted to bullish . price reclaimed a very strong S/R zone. I would long the retracement to the golden pocket and the daily OB breaker. anywhere between 22.37-23.37 is a good long. stop below the low

Ethereum Classic ETC bullish ahead of the FOMC Press ConferenceI am bullish on Ethereum Classic ETC ahead of the FOMC Press Conference.
Those are my price targets:
ETC/USDT
Entry Range: $23 - 25
Price Target 1: $28
Price Target 2: $34
Price Target 3: $41
Stop Loss: $19

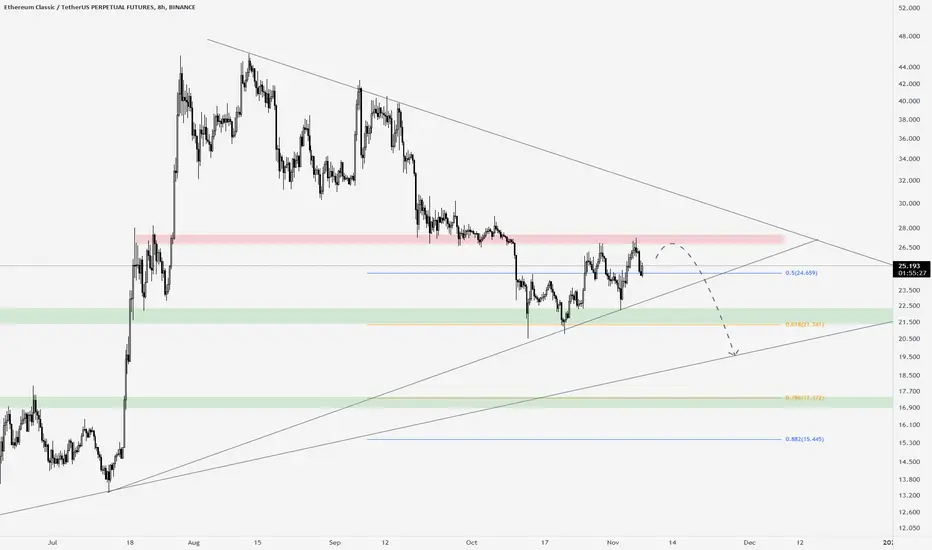
ETCUSD ❕ downtrendETC is moving in a downward channel under liquidity.
On the 4H Timeframe, the outermost candle forms an upper ascending shadow, which indicates weakness in buyers.
RSI is in the bearish zone (4H TF)
Price has broken down 50EMA (4H TF)
I expect a decline after fixing in the channel.

Short ETCUSDTUtilizing DOW theory to spot the trend and find out the best possible entry with bullish candle stick patterns.
Looking at the 1h timeframe, instrument is not making more higher highs (HH=26.86), need to confirm the downtrend from new LH,LL. We get the confirmation upon breaking first HH suggesting a bullish trend . I will look for a bearish candle pattern(bearish engulfing forming) in buy range 24.6-24.4 to get best higher possible entry as compared to previous LL (Dow Theory). Hence a possible short position is there with stop loss a little above previous Lower high and take profit at 6.80 and 7.0.
Short Position
Risk 2%
Reward/Risk : 2
Buy zone : 24.6-24.4
STOP Loss : 25.01
TP1: 24.0
Tp2 : 23.50
