ETC_USDT Long scalp idea
elliott wave analaysis
Risk is yours as always. Manage it properly
Not financial advice.
ETCUSDT trade ideas

EtcWe are witnessing the formation of a bull flag pattern. In fact, the newly discovered price is ready to go up to the white line at least.God save you

ETC/USDTWhen Eth gose to pos then miners will moved to other pow projects and the 2nd best optician for miners is Eth Classic...

ETC/USDT is it time to launch? Hello guys
Another one on our watchlist is ETC/USDT but this time on 1hr chart. We see a pretty clean setup being formed for this coin which gives us a multiple confirmation of bullish movement soon to happen: Small uptrend, Sitting at support, Being above EMA100 and pushing towards EMA200. What do you think guys?
If you like ideas provided by our team you can show us your support by liking and commenting.
Yours Sincerely,
Swallow Team 🔱
Disclamer:
We are not financial advisors. The content that we share on this website are for educational purposes and are our own personal opinions.

ETHEREUM Classic has many miners, they will pump ETC price againThe fall in the ETHEREUM Classic price is happening on lower volumes.
A modest update of the lows and something like a downward wedge is formed within the correction. Usually such a pattern later acts as a continuation of the growth trend.
We think that in the area of $26-28 it is logical to try to take the longs of the ETCUSDT. Sooner or later the ETC price will be pumping again, and the minimum growth potential in the medium term is x2 to the area of 51dollars.
_____________________
Did you like our analysis? Leave a comment, like, and follow to get more

ETHUSDT | Breakthrough coming soon!Hello trader Today I have prepared a new idea for you. Like and subscribe to the channel there is a lot of useful information✅
The asset is now moving in a downward channel, showing a protracted consolidation.
If there is a squeeze to the 0.618 Fibonacci zone, then from there you can consider short with a short stop at $28.80
Guys not financial advice, just sharing my thoughts on the schedule!

Possible ascending triangle ETCUSDT 15mPossible ascending triangle ETCSDT 15m
Before entry wait for breakout, have fun.

ETC - Possible ReboundETC is sitting on a support zone generated in August on the 4H time frame.
A rebound is possible if these price levels hold.
Trade with caution

Ethereum Classic - Yellow Horizontal The yellow horizontal on this analysis provides a great support for this preemptive breakout structure
Price has extended itself to the top of the descending megaphone
From here a breakout of this megaphone and in turn the flag like structure continues the breakout on a timeframe such as the Weekly.
This is the daily timeframe.

ETCUSDT Hi traders! as drawn the trendline in my analysis ,Maybe we can get up to 35 🧑🚀 and then go down to the areas 18/16

ETCUSDT| LOOK FOR BREAKOUTETCUSDT has been trading under the falling trendline.
The price approached to horizontal support and price bounced back.
Now the price has holding an important support level while trading near the falling trendline.
One can look for breakout on either side.
1) if price break above, one can enter for long positions
2) if price break below support one can short
Trade your levels accordingly.

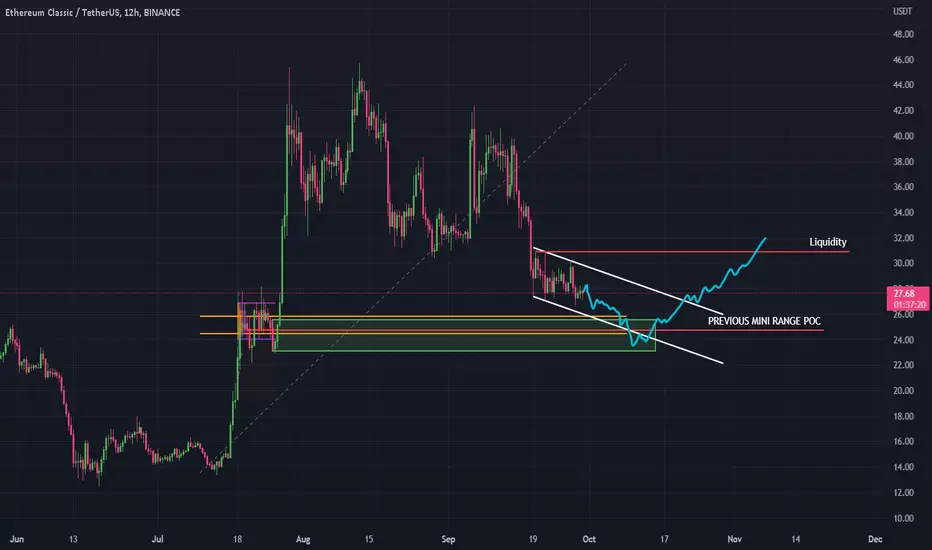
ETC POSSIBLE LONG IDEAI think after some consolidation at this no man's land we will come down to the last 12H BULLISH OB, wich is in confluence with the Golden POCKET. In this zone i would like to see some fakeout type move from this actual channel into the previous mini range POC, and from there a big reaction to the up move, and I think, if this SCENARIO is correct, then my target would be liquidity zone.
ETCUSDTETC will go down to test the OB then hunt the sell stops then to buy stops.
smart money movment.
be safe

Etc again longAll the conditions of this signal are valid only. The yellow dots are the target
And
Amount : min
Order difference : 0.07%
Order sell: 0.19%

ETC LONG IDEAI will not enter trade alredy expose in 2 trades KDA and BTG
risk 1%.
4h trading time frame.
we have two targets:
targe 1 : inside bull flag
target 2 : base in 4h fibonnachi
tradable pattern: SHORT TERM UPTREND
Positive arguments
+forming bull flag with ABC cirection
+CTB counter trend line brake (orange line)
+short term uptrend
+potencial H&S formation
+1D bullish candel stick formation
+bounce from past support (BLUE AREA)
+4h original fibonnachi with confirmed C

🔥 What heppen to ETC after the MERGE? BULLISH FLAG breakout🚩Hi friedns! ETC is moving in the huge bull flag. Let`s talk about the most potential scenarious for the ETC price.
Ethreum Classic is the oldest ETH fork and we see how it`s following the ETH price. Huge dump of ETC happen at the same time after the ETH MERGE. Even if other altcoin make a reverse, the price of ETC will follow the ETH.
✅ After this correction i can expect some pullback. The price fall to 2 important support levels:
1️⃣ the bottom boundary of the bullish flag🚩
2️⃣ the huge value area of $25-28
📊 When you should open a long:
🔥 the whales liquidity collection (false breakout) below the bottom boundary of flag
🔥 the volume growth during the false breakout which confirms the pressense of whales
🔥 DOM and Footprint confirmation of the big orders to BUY at the bottom. These scalping tools help me to identify the whales who want to trap the retailers. In the most cases the bounce from this size lead to the pump and you make 1:5-20RR trades.
🔥 bullish BTC force all the altcoins reach the targets
✅ The closest target is the top boundary of the of the bullish flag ($36-38)🚩 The huge value area are also there, so you can book 50-70% of your profit. The pullback is hughly expected.
🚩 If the price fall below the value area of $25-28 and BTC will be bearish, ETC easilly reach the $15-16. In this case we can open our short on the test of the flag or this value area as the resistance with short sl and nice RR.
💻Friends, press the "boost"🚀 button, write comments and share with your friends - it will be the best THANK YOU.
P.S. Personally, I open an entry if the price shows it according to my strategy.
Always do your analysis before making a trade.

ETC/USDT getting ready! Hello guys
Another one on our watchlist is ETC/USDT. After several pumps and dumps this coin has we see there might be a chance of getting to upper levels of EMA soon. We are waiting for price to reach EMA50 in order to set our buys and hopefully going towards EMA100 and EMA200. What do you think here guys?
If you like ideas provided by our team you can show us your support by liking and commenting.
Yours Sincerely,
Swallow Team 🔱
Disclamer:
We are not financial advisors. The content that we share on this website are for educational purposes and are our own personal opinions.

Bullish ETCThe market is accumulating momentum to reverse the trend and will soon test at least one of the resistance levels indicated on the chart.

ETC LONG TREND LİNE⚡️⚡️#ETC/USDT ⚡️⚡️ 📶 ETC/USDT – 1hour – Abnormal Volume Detected – 29.19 – 16:51:02 (UTC+0300) – BINANCE –
Exchanges: Binance Futures 🚀
Signal Type: Regular Long
Leverage: Cross (X20)
Amount:0.50%
Entry Targets:
1) 29.190
2) 28.350
3) 27.591
Take-PrOfit Targets:
1) 30.068
2) 30.883
3) 32.284
4) 33.147
5) 34.541
6) 36.175
7) 38.505
Stop Targets:
1) 26.213

✅TS ❕ ETCUSD: rebounded sharply✅✅ETCUSD is moving around the support level. Several lows have already been formed at this level, after which the price bounced up. I expect a rebound and growth.✅
🚀 BUY scenario: long to 30.88.🚀
----------------------------------------------------------------------------
Remember, there is no place for luck in trading - only strategy!
Thanks for the likes and comments.

ETC still have a correctionI don't think Ethereum Classic is ready to rise yet, and it seems that the correction of this currency will continue

ETCUSDTETCUSDT
Is it at support level expecting move higher the rsi is also bottomed
Yellow line are tp for reference

ETCI think the price will move in a bearish scenario: it will bounce from the daily 100 MA to the daily 100 EMA, then it will move through support levels and weekly MAs.
