Decision Phase in ETHBTCI would like to offer an idea about ETHBTC. Although it showed a nice bottom formation with its last breakout move, I think it is at a very critical point with the horizontal movement and downward break that followed. If you look at the ETH chart ( ) , you can see that it corrected almost 60% of it
Key data points
Previous close
—
Open
—
Day's range
—
About Market Cap ETH, $
Coin
Ethereum needs no introduction: the most popular altcoin in the market that has grown immensely since its launch in 2015, setting the bar quite high for others; the network that allows developers build other tools providing — among other things — for decentralized finance... The list of achievements is a long one. Among the latest is the adoption of the Proof-of-stake mechanism which has made Ethereum a greener alternative to the all-mighty Bitcoin. Clearly, any crypto investor is interested in Ethereum to some extent, so we've prepared the chart of ETH market cap, the number of coins in circulation times their current price. If you always wanted to, but doubted whether to buy ETH, the chart might help dispel your concerns — the rising line indicates investors' confidence and will to support the network. The opposite direction might be a sign to reconsider your strategy and prepare more effectively.

Only apes are aping in ETH after 40%+ rally Don't be ape, wait for retest of previous lows.
ETH is not gold its not something you can't LIVE WITHOUT.
It's digital finance token buy it when it's cheap short it when makes 40% sudden moves like this by bots and market makers.
Don't be APE wait for entry

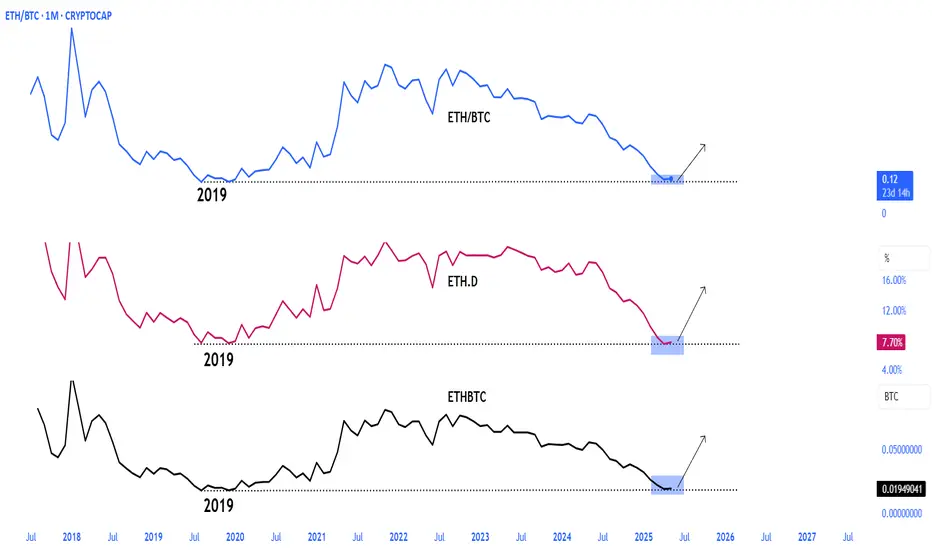
$ETH + $BTC CryptocapCRYPTOCAP:ETH + CRYPTOCAP:BTC Cryptocap pair confirms the r-test phase after the handle cup formation breakout

The market cap of ETH grow up to $380B-$420B and in 2024 will faThe market cap of ETH grow up to $380B-$420B and in 2024 will fall to FWB:70B -$80B
January 17, 2024

ETH to start outperforming smaller ALTSEthereum season is upon us!
Smaller ALTS will start bleeding against ETH until April, May.

SOLANA to challenge ETH Marketcap. Can it Flip?In the previous cycle, Solana struggled to compete with Ethereum's market cap. Even if you were to subtract Solana's market cap from Ethereum's peak, you'd still find yourself with a surplus of half a billion dollars. However, the situation has changed, as Solana is now less than three times away fr

Ethereum vs XRP / Which direction will it take?For people who have both ETH and XRP, this is an interesting chart (mostly for fun, I don’t trade on it). ETH has gone down by about 84%(!!!) against XRP in a very short time and is now almost at the bottom of a channel (still about 10% drop to go). After that it will become clear which way ETH/XRP

$1 trillion is inevitable for #Ethereum market cap!CRYPTOCAP:ETH will be among the most valuable companies in the world

ETH move will be massiveETH/TOTAL3 is at dip.
This will be the one of the most spectacular move of crypto so far.
Target price for ETH is ~$9000

See all ideas
Summarizing what the indicators are suggesting.
Oscillators
Neutral
SellBuy
Strong sellStrong buy
Strong sellSellNeutralBuyStrong buy
Oscillators
Neutral
SellBuy
Strong sellStrong buy
Strong sellSellNeutralBuyStrong buy
Summary
Neutral
SellBuy
Strong sellStrong buy
Strong sellSellNeutralBuyStrong buy
Summary
Neutral
SellBuy
Strong sellStrong buy
Strong sellSellNeutralBuyStrong buy
Summary
Neutral
SellBuy
Strong sellStrong buy
Strong sellSellNeutralBuyStrong buy
Moving Averages
Neutral
SellBuy
Strong sellStrong buy
Strong sellSellNeutralBuyStrong buy
Moving Averages
Neutral
SellBuy
Strong sellStrong buy
Strong sellSellNeutralBuyStrong buy
Displays a symbol's price movements over previous years to identify recurring trends.