$6000 by end of 2025 - Bullish trend on the way Hello all traders, I know this is not a professional analysis, but it's just my simple chart with Fib tool and trend line.
since year 2020 we are on the up trend til 2025, since then we never break through the main trend line, and I don't think we will see the price going under that main up trend line.
crypto curruncies since started and it is over the main up trend
I draw a divergence lines on the low points in the chart and RSI, this divergence indicate a bullish is coming, we can say it is just started.
by end of 2025, ETH will reach $6000
I hope you understand my humble english, and my humble analysis.
thanks for taking time reading :)
good luck all.
ETHBEARUSD trade ideas

price movement of Ethereum (ETH) against the US Dollar (USD) Chart Details:
Current Price: 2,251.2 USD (+0.43%)
Trading Pattern: A downward channel (falling wedge) indicates a bearish trend.
Trading Strategy:
Stop Loss: 2,220 USD (marked in the red zone)
First Take Profit Level: 2,280 USD
Target Profit Level: 2,300 USD
This chart suggests a potential sell trade, where the price may break out downward from the channel. If the price reaches 2,280 USD, the first take profit level is achieved, while further decline to 2,300 USD is expected. If the price moves above 2,220 USD, the stop loss will trigger, limiting potential losses.

ETH D Swing long scenarioETH D since C-19 dump. Fibbs golden pocket in confluence with VPVR upper range, not exactly, but very close and in confluence with one of the volume nodes at $1800. Those 3 macro things are big targets and I want to see ETH to touch it. The 4th is macro Resistance/Support line at this level, it has been tested multiple times and it is currently at this support, which is extended right below $1800. I dont think market is so weak to let ETH drop below this support, that is the bear market scenario with $1200 target. IMO the symmetrical triangle is filled by 3/4 and ready to be broken, upside. This area can be a buy zone and swing long setup, where risk is very low at those levels

(ETH) ethereum "sliding scale"A view of Ethereum per the indicator I use the most, moving average with increments of a year, and symbols to determine the crossover/under patterns. dots are bad, plus signs are good generally based on the indicator.

Bullish bounce?Ethereum (ETH/USD) has bounced off the pivot which has been identified as a pullback support and could rise to the 1st resistance.
Pivot: 2,155.83
1st Support: 1,992.06
1st Resistance: 2,399.50
Risk Warning:
Trading Forex and CFDs carries a high level of risk to your capital and you should only trade with money you can afford to lose. Trading Forex and CFDs may not be suitable for all investors, so please ensure that you fully understand the risks involved and seek independent advice if necessary.
Disclaimer:
The above opinions given constitute general market commentary, and do not constitute the opinion or advice of IC Markets or any form of personal or investment advice.
Any opinions, news, research, analyses, prices, other information, or links to third-party sites contained on this website are provided on an "as-is" basis, are intended only to be informative, is not an advice nor a recommendation, nor research, or a record of our trading prices, or an offer of, or solicitation for a transaction in any financial instrument and thus should not be treated as such. The information provided does not involve any specific investment objectives, financial situation and needs of any specific person who may receive it. Please be aware, that past performance is not a reliable indicator of future performance and/or results. Past Performance or Forward-looking scenarios based upon the reasonable beliefs of the third-party provider are not a guarantee of future performance. Actual results may differ materially from those anticipated in forward-looking or past performance statements. IC Markets makes no representation or warranty and assumes no liability as to the accuracy or completeness of the information provided, nor any loss arising from any investment based on a recommendation, forecast or any information supplied by any third-party.

ETHUSD SELLThis analysis is based on the provided image and must not be taken as financial advice. Trading involves risks, so conducting your own research and consulting with a financial advisor before making any trading decisions is crucial.

ETH Inverse Head & Shoulders – Potential Bullish ReversalEthereum (ETH/USD) has recently formed an *inverse head and shoulders* on the 1-hour timeframe, a classic bullish reversal pattern. The left shoulder, head, and right shoulder have completed their formation, with the “neckline” roughly around the $2,400–$2,450 region. A decisive break and close above this neckline could indicate a shift in momentum favoring buyers.
From a technical perspective, the *measured move* suggests a possible climb toward the $3,000 zone. This level is derived by measuring the distance from the “head” low to the neckline, then projecting that same distance upwards from the breakout point.
Before ETH makes a full run at $3,000, price may retest the neckline area as new support. Such a pullback is normal in this kind of setup, allowing traders to confirm the breakout’s validity. If the neckline holds, it would further cement the bullish bias and provide a potential buying opportunity.
Momentum Indicators
Looking at momentum oscillators (like the Stochastic at the bottom of the chart), we see signs of *overbought* or *cooling-off* conditions, which could hint at a short-term pullback. Nevertheless, a retest of the neckline combined with a reset in momentum indicators could open the door for the next leg higher.
Key Levels to Watch
• Neckline/Support: $2,400–$2,450
• Upside Target: Around $3,000
• Potential Failure: A sustained drop below the right shoulder (around $2,300) could invalidate the bullish scenario.
Strategy
• Aggressive Entry: Consider entering on a confirmed breakout above the neckline with strong volume.
• Conservative Entry: Wait for a pullback to the neckline and look for bullish confirmation (e.g., a bullish candlestick pattern, bounce in volume) before entering.
• Risk Management: A stop-loss below the head (or below the right shoulder) can help limit downside if the pattern fails.
The inverse head and shoulders points to a bullish reversal for ETH/USD, with a potential journey toward the $3,000 zone. However, traders should remain cautious of possible retests or short-term pullbacks, particularly if momentum indicators continue to cool off. Stay vigilant, manage risk appropriately, and remember that market conditions can change rapidly.

ethusd buy tradeThe Relative Strength Index (RSI) is showing an upward trend, indicating increasing momentum. Additionally, the Moving Average Convergence Divergence (MACD) is showing a bullish crossover, further supporting the potential for an upward move.

Death of ETH ?ETH is currently trading at a crucial support zone. A breakdown from this strong level could push ETH into a bearish trend, making recovery difficult.
However, if ETH manages to reverse from the $1,800–$2,000 support zone, there’s hope for a strong performance ahead. A further crash below this zone could have a severe impact on the entire Ethereum ecosystem.
The next two weeks will be critical—let’s see how things unfold. Hoping for a reversal from this support level!
Stay tuned for more updates.
Cheers,
GreenCrypto Team

Free ETH TradeSL: 2,992
TP 1 : 3,064
TP2 : 3,199
TP 3 : 3,229
ETH & the majority of the market have taken a recent dip between 18% - 22%
Recent rejection off 2,800 LVL has been great confluence to a bullish correction reaching the bottom of the Down Trend Line formed above.
Safe Trading, PPFX

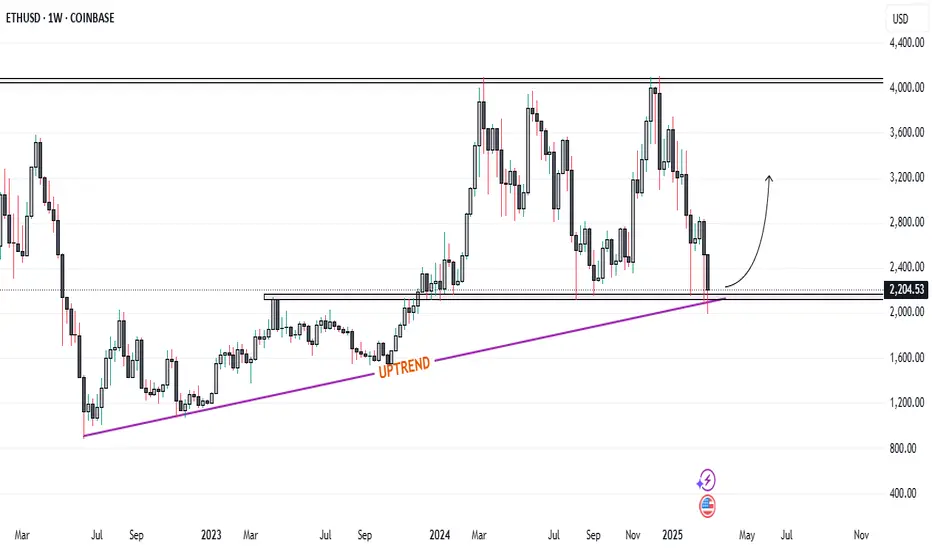
Ethereum Holds Key Support at Weekly Trendline: What's Next...?Ethereum Holds Key Support at $2,100: Could a Rally to $4,000 Be Coming? Altcoin Season and Trump’s Crypto Summit as Potential Catalysts
Ethereum is currently finding support at a critical juncture, with the price holding steady at the weekly uptrend line and an important support level around the $2,100 mark. Historically, every time Ethereum has tested this support zone, it has bounced significantly, often making strong moves toward the $4,000 level. The question now is whether history will repeat itself.
At this point, Ethereum’s ability to maintain this support level is crucial. With the market in a generally cautious state, Ethereum's resilience at this key level could signal the potential for a powerful rally in the near future. The broader crypto market is also awaiting the highly anticipated "altcoin season," where altcoins—especially Ethereum—could see a surge in demand, potentially driving prices higher.
Adding to the excitement, former U.S. President Donald Trump is set to host a crypto summit at the White House on March 7. This event could serve as a major catalyst for the next crypto rally, especially if significant regulatory or institutional insights emerge. The combination of Ethereum holding its critical support, the potential for altcoin season, and the White House summit could create the perfect storm for a significant price movement in Ethereum.
As Ethereum continues to hover around the $2,100 mark, traders and investors are closely watching for any signs of a breakout. If the rally to $4,000 materializes, it could set the stage for further gains, with the broader crypto market potentially following suit. The next few weeks could prove to be pivotal for Ethereum and the cryptocurrency space as a whole.
ETH/USD 1HOUR CHART TECHNICAL ANALYSIS NEXT MOVE POSSIBLE.This chart represents an Ethereum (ETH/USD) technical analysis on the 1-hour timeframe. Here’s what it indicates:
Key Points in the Chart:
1. Buy Zone (Support Area) → Around 2,000-2,050:
Price previously found strong support in this region, meaning buyers stepped in aggressively.
The chart suggests that price bounced from this area, confirming it as a demand zone.
2. Sell Zone (Resistance Area) → Around 2,400-2,500:
This zone is highlighted as a potential area where selling pressure could emerge.
Price may struggle to break above this level, making it a target for traders looking to take profit.
3. Lower Risk Sell Zone (~2,700-2,800):
This is an extended resistance area where selling could be safer with lower risk.
It suggests that if price continues to rise, a short position might be better at this level.
4. Expected Price Movement:
The blue arrows indicate a projected bullish move from the Buy Zone to the Sell Zone before a possible rejection.
Traders might look to enter long (buy) positions near the Buy Zone and exit or go short near the Sell Zone.
Trading Strategy Based on This Analysis:
Long (Buy) from Buy Zone (~2,000) → Target Sell Zone (~2,400-2,500).
**Short (

ETH in a LIVERMORE Accumulation cylinder.What is a Livermore accumulation cylinder?
The Livermore Accumulation Cylinder gained fame through the insights of Jesse Lauriston Livermore, a Massachusetts-born American investor celebrated as one of the most exceptional traders in history. His theory revolves around what is often referred to as an ascending broadening wedge, a phenomenon that unfolds over extended time frames.
What is an accumulation cylinder with a widening mouth?
First recognized by the iconic trader Jesse Livermore, who essentially laid the groundwork for technical analysis, the 'Accumulation Cylinder with Widening Mouth' is a unique and gradually developing pattern. In this scenario, the price oscillates between two diverging lines, creating a tension that can lead to a significant upward breakout.
Is Ethereum resolving its own Livermore cylinder?
This isn’t the first instance of cryptocurrency showcasing a Livermore cylinder: Ethereum might currently be in the midst of resolving its own version, and Bitcoin may have experienced a similar pattern back in 2017. While the charts may seem to align quite well, it’s crucial to remember that they are not a guarantee of future outcomes. Instead, they can serve as a valuable guide for managing risk, setting expectations, and establishing realistic profit targets. Many newcomers to crypto dream of achieving a 100x return, but as demonstrated by Bitcoin whales, true profits often come from strategically trimming and adjusting their positions, making only a few calculated moves from cycle to cycle.


Ethereum local top yet to be seen!Ethereum season has not yet fully started.
The place where the cash in the market will circulate will be eth. This is not an unusual situation and it is inevitable.

ETHUSD Is Bullish! Long!
Here is our detailed technical review for ETHUSD.
Time Frame: 9h
Current Trend: Bullish
Sentiment: Oversold (based on 7-period RSI)
Forecast: Bullish
The market is trading around a solid horizontal structure 2,237.6.
The above observations make me that the market will inevitably achieve 2,552.5 level.
P.S
The term oversold refers to a condition where an asset has traded lower in price and has the potential for a price bounce.
Overbought refers to market scenarios where the instrument is traded considerably higher than its fair value. Overvaluation is caused by market sentiments when there is positive news.
Like and subscribe and comment my ideas if you enjoy them!


Bullish; aiming 3000 maybe higherDuring the struggle and ups then down and now finally shine is up ahead.
Ima keep this short; i like Ether to hit 3000. But getting back to the yearly ATH ( 4,885) is possible.
First back to 2600 then 3000. But 4,100 is the huge resistance that the bulls need to break. If the bulls keep this momentum bullish even upside then its possible to hit the milestone 5000.
Hold onto your bags
And be sure to use proper risk management

Potential bullish rise?Ethereum (ETH/USD) is falling towards the pivot and could bounce to the 1st resistance which has been identified as a pullback resistance.
Pivot: 2,098.80
1st Support: 1,941.25
1st Resistance: 2,384.00
Risk Warning:
Trading Forex and CFDs carries a high level of risk to your capital and you should only trade with money you can afford to lose. Trading Forex and CFDs may not be suitable for all investors, so please ensure that you fully understand the risks involved and seek independent advice if necessary.
Disclaimer:
The above opinions given constitute general market commentary, and do not constitute the opinion or advice of IC Markets or any form of personal or investment advice.
Any opinions, news, research, analyses, prices, other information, or links to third-party sites contained on this website are provided on an "as-is" basis, are intended only to be informative, is not an advice nor a recommendation, nor research, or a record of our trading prices, or an offer of, or solicitation for a transaction in any financial instrument and thus should not be treated as such. The information provided does not involve any specific investment objectives, financial situation and needs of any specific person who may receive it. Please be aware, that past performance is not a reliable indicator of future performance and/or results. Past Performance or Forward-looking scenarios based upon the reasonable beliefs of the third-party provider are not a guarantee of future performance. Actual results may differ materially from those anticipated in forward-looking or past performance statements. IC Markets makes no representation or warranty and assumes no liability as to the accuracy or completeness of the information provided, nor any loss arising from any investment based on a recommendation, forecast or any information supplied by any third-party.

PROJECTION, Possible accumulation on 4H chart in ETH/USDTPROJECTION, Possible accumulation on 4H chart in ETH/USDT
In 1H, purchases (long) are expected within 7 to 8 hours, from $2,172 and exits at $2,273.

ETHUSD Short: Break of a 2 year trendlineA simple short idea only because of a break in the longer-term trendline. Nothing sophisticated.

EthereumETHUSD ( Ethereum / U.S Dollar )
This Analysis is based on these Factors :
1. Bearish Channel
2. Elliot Waves
3. Point of Interest
4. Break of Structure
5. S / R Level

