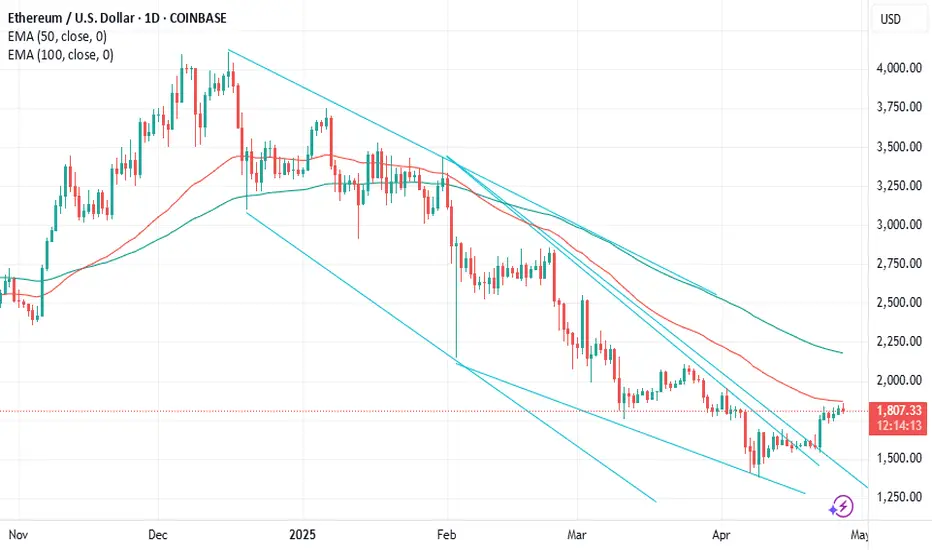
ETH Breaks Out of Falling Wedge, Eyes $2800 TargetEthereum (ETH) has broken out of a falling wedge pattern, signaling a potential bullish move. If the breakout sustains, the price could rally towards the projected target in the $2800 region, based on the wedge’s height.
ETHBEARUSD trade ideas

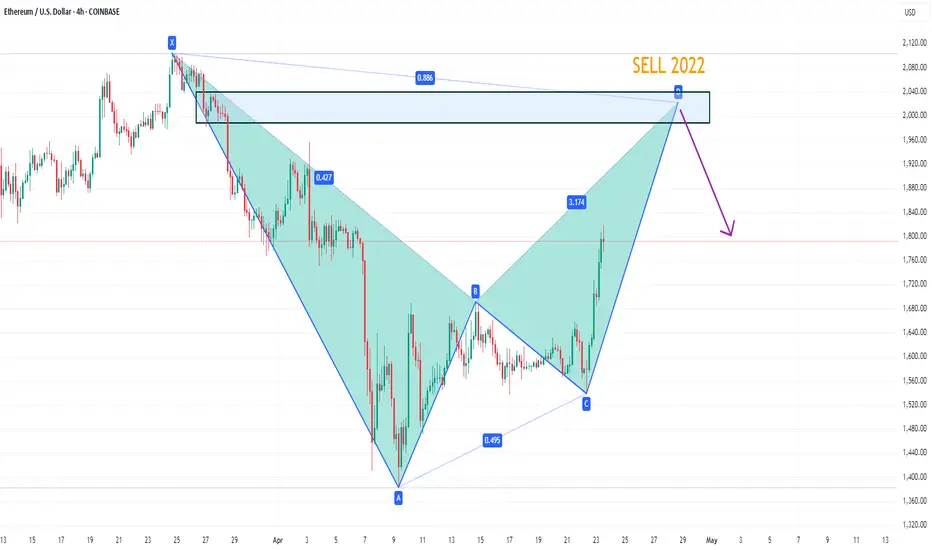
ETHUSD potential bearish bat patternOn the 4-hour chart, ETHUSD stabilized and rebounded. The current upper resistance is around 2022. Once it reaches that level, pay attention to the potential bearish bat pattern. At the same time, this position is in the previous supply area.
EthereumETHUSD
- Bearish Channel as an corrective pattern in Short Time Frame
- Break of Structure
- RSI - Divergence
- Completed " 1234 " Impulsive Waves
- Change of Characteristics

ETH turned bullish on the daily chart, great R:R hereTargeting mid to upper 3000s in the mid-term (2-3 months) and expecting 5k plus by year end. ETH will get it's turn, don't worry

ETH/USD bearish trend(A Corrective Pullback)The sharp drop from 1,803 created an FVG around 1795–1800, which price is currently filling. A rejection at the bearish order block (1800–1803) could lead to a bearish continuation toward 1790 or lower then expect a bullish reversal targeting 1810–1815. then 1850. & then 1963 & so forth & so on. Watch for confirmation during the London or New York kill zones.

Ethereum signal Ethereum sell......
Entry .....1814.6
Target..............1800
SL.............1827.7

ETH SUNDAY SHORTshort from test after UTAD in distribution/ re-acummulation pattern, looking to reach the low of the range before reversing up again.

Weekly Cryptocurrency Analysis:Ethereum(ETH)–Issue 274(FreeThe analyst believes that the price of ETHUSD will decrease within the time specified on the countdown timer. This prediction is based on a quantitative analysis of the price trend.
___Please note that the specified take-profit level does not imply a prediction that the price will reach that point. In this framework of analysis and trading, unlike the stop-loss, which is mandatory, setting a take-profit level is optional. Whether the price reaches the take-profit level or not is of no significance, as the results are calculated based on the start and end times. The take-profit level merely indicates the potential maximum price fluctuation within that time frame.

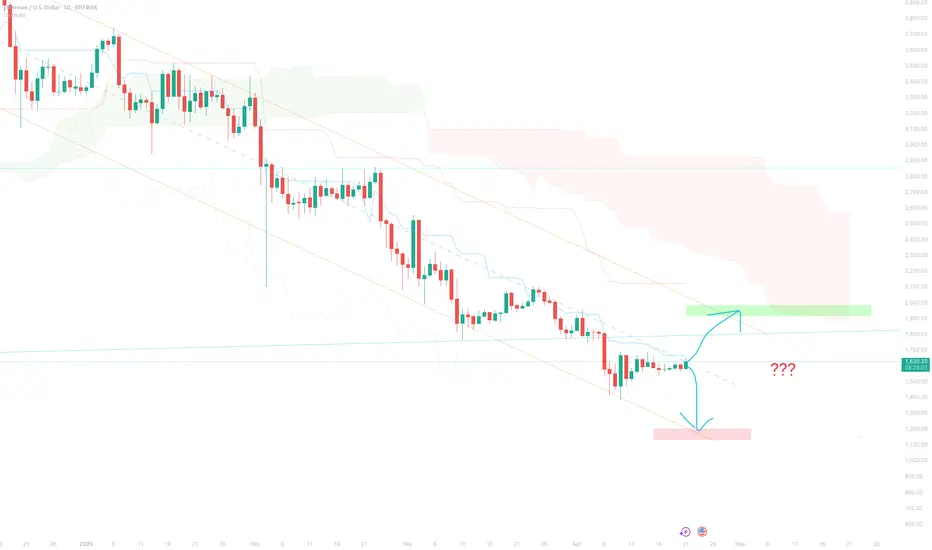
What's Next for ETH $1,200 or $2,000?If we can confidently break through the Middle Line of the downward Trend, then we go to $2k.
In general, the Fundamental is on the side of Ether.
The Main Factor Wall Street launches ETH-ETF Staking with a yield of 3-5% per annum.
This Feature Makes Ether Stand Out from Other Assets.
ETH - Cash inflowThe price of Ethereum has remained stable in the $1,500 to $1,600 range for about a month, but according to the analysis of indicators that are positively correlated with Ethereum, we can see the influx of liquidity into the market and we expect this digital currency to increase to the target range in the coming days.
Sasha Charkhchian

Ethereum H4 | Falling toward a pullback supportEthereum (ETH/USD) is falling towards a pullback support and could potentially bounce off this level to climb higher.
Buy entry is at 1,674.75 which is a pullback support that aligns close to the 38.2% Fibonacci retracement.
Stop loss is at 1,520.00 which is a level that lies underneath a multi-swing-low support and the 61.8% Fibonacci retracement.
Take profit is at 1,913.15 which is a swing-high resistance.
High Risk Investment Warning
Trading Forex/CFDs on margin carries a high level of risk and may not be suitable for all investors. Leverage can work against you.
Stratos Markets Limited (tradu.com):
CFDs are complex instruments and come with a high risk of losing money rapidly due to leverage. 63% of retail investor accounts lose money when trading CFDs with this provider. You should consider whether you understand how CFDs work and whether you can afford to take the high risk of losing your money.
Stratos Europe Ltd (tradu.com):
CFDs are complex instruments and come with a high risk of losing money rapidly due to leverage. 63% of retail investor accounts lose money when trading CFDs with this provider. You should consider whether you understand how CFDs work and whether you can afford to take the high risk of losing your money.
Stratos Global LLC (tradu.com):
Losses can exceed deposits.
Please be advised that the information presented on TradingView is provided to Tradu (‘Company’, ‘we’) by a third-party provider (‘TFA Global Pte Ltd’). Please be reminded that you are solely responsible for the trading decisions on your account. There is a very high degree of risk involved in trading. Any information and/or content is intended entirely for research, educational and informational purposes only and does not constitute investment or consultation advice or investment strategy. The information is not tailored to the investment needs of any specific person and therefore does not involve a consideration of any of the investment objectives, financial situation or needs of any viewer that may receive it. Kindly also note that past performance is not a reliable indicator of future results. Actual results may differ materially from those anticipated in forward-looking or past performance statements. We assume no liability as to the accuracy or completeness of any of the information and/or content provided herein and the Company cannot be held responsible for any omission, mistake nor for any loss or damage including without limitation to any loss of profit which may arise from reliance on any information supplied by TFA Global Pte Ltd.
The speaker(s) is neither an employee, agent nor representative of Tradu and is therefore acting independently. The opinions given are their own, constitute general market commentary, and do not constitute the opinion or advice of Tradu or any form of personal or investment advice. Tradu neither endorses nor guarantees offerings of third-party speakers, nor is Tradu responsible for the content, veracity or opinions of third-party speakers, presenters or participants.


$ETH It's never to late to get on EMA 50 hitETH is on a climb, its still 50% cheaper than beginning of year.

Short-Medium Recovery For ETHUSDInverted H&S reversal likely building. Bearish continuation structure on Left Shoulder likely sees a mirroring effect here, synchronicity is common in shoulder formations and makes for a stronger neckline.
Targeting 2392 (+25%) should we get a meaningful break of 1820 level.
Trade Status - Pending. Likely to chop around a bit more first (see potetnial left shoulder formation). Look for tightening volatility compression for more optimal entry.

Enter The HeavensI’m 60/40 on this setup…maybe 75/25. I believe ETH has snatched up enough liquidity to enter the heavens. We shall see.

ETH - weekly plan Marked the important levels in this video for this week and considered a few scenarios of price performance
Important support level for this week is $1,700
Write a comment with your coins & hit the like button and I will make an analysis for you
The author's opinion may differ from yours,
Consider your risks.
Wish you successful trades! MURA

ETH is moving within the 1,550.00 - 1,830.00 range👉🏼 Possible scenario:
Ethereum dropped 3.3% to $1,754, echoing a broader 3.6% market correction. But under the surface, long-term holders are accumulating, with over 640,000 ETH flowing into wallets that haven’t sold since 2018—a multi-year high.
On-chain metrics show growing conviction: active addresses surged 10% in just two days, signaling rising network engagement. Despite short-term volatility, investor positioning suggests quiet confidence in Ethereum’s long-term fundamentals.
✅Support and Resistance Levels
Support level is now located at 1,550.00.
Now, the resistance level is located at 1,830.00.


Ethereum Trades Sideways: Bulls Need a PushFenzoFx—Ethereum is trading sideways but remains above the 50-period simple moving average, signaling a bullish market. ETH is currently priced around $1,785. A close above $1,835 could trigger a move toward the $1,950 resistance.
Bearish Scenario:
If Ethereum falls below $1,690, supported by the 50-period simple moving average (4-hour chart), it could decline toward the $1,565 support level.

ETHUSD: Strong Growth Ahead! Long!
My dear friends,
Today we will analyse ETHUSD together☺️
The market is at an inflection zone and price has now reached an area around 1.800.9 where previous reversals or breakouts have occurred.And a price reaction that we are seeing on multiple timeframes here could signal the next move up so we can enter on confirmation, and target the next key level of 1.828.4.Stop-loss is recommended beyond the inflection zone.
❤️Sending you lots of Love and Hugs❤️

Weekly-Analysis:Ethereum (ETH)–Issue 275 (Free access)The analyst believes that the price of ETHUSD will increase within the time specified on the countdown timer. This prediction is based on a quantitative analysis of the price trend.
___Please note that the specified take-profit level does not imply a prediction that the price will reach that point. In this framework of analysis and trading, unlike the stop-loss, which is mandatory, setting a take-profit level is optional. Whether the price reaches the take-profit level or not is of no significance, as the results are calculated based on the start and end times. The take-profit level merely indicates the potential maximum price fluctuation within that time frame.

ETH - Log long Chart!Hello TradingView Family / Fellow Traders. This is Richard, also known as theSignalyst.
Let’s keep it simple! ⚡
📈 ETH is approaching a major structure and potential rejection zone marked in blue.
As long as this key support holds, the long-term bullish bias remains intact.
It’s only a matter of time before the bulls step in — confirmation will come from lower timeframes. 👀
📚 Always follow your trading plan regarding entry, risk management, and trade management.
Good luck!
All Strategies Are Good; If Managed Properly!
~Rich
