ETH/USD Coinbase Trading Plan. AI Prediction Apr 29, 2025 ETH/USD Trading Plan
Short-Term (24-48 Hours)
Long Entry : 1825 (Confirmed if price breaks 1830 with volume >6000).
SL : 1795 (10 points below support). TP: 1845 (just above resistance). Trailing Stop: 1.5% after TP1 (1845).
Short Entry : 1795 (Confirmed if price closes below 1800 with volume >5000).
SL : 1815 (10 points above entry). TP: 1760 (above 1750 support). Trailing Stop: 1.5% after TP1 (1760).
Long-Term (3-7 Days)
Long Entry : 1850 (Confirmed with daily close above 1840 + rising volume).
SL : 1820 (30 points below breakout). TP: 1900. Trailing Stop: 2% after price reaches 1900.
Short Entry : 1740 (Confirmed with daily close below 1750).
SL : 1765 (15 points above entry). TP: 1700. Trailing Stop: 2% after price hits 1700.
Re-Evaluate Forecasts If:
- Price stalls at key levels (1840 or 1750) for >6 hours without momentum.
- Volume drops sharply during a breakout/breakdown.
- External catalysts (news, macros) emerge.
Confirmation Tools:
Volume spikes (>6000 for longs, >5000 for shorts), candlestick reversals (hammer/shooting star), and consolidation breaks.
Disclaimer: This is not financial advice. Crypto markets are highly volatile and speculative. Always do your own research and consult a qualified financial advisor before investing. You could lose your entire investment.
ETHBEARUSD trade ideas

ETHUSD INTRADAY sideways consolidation supported at 1726ETH/USD maintains a bullish sentiment, supported by an ongoing upward trend. However, recent intraday price action shows signs of sideways consolidation, suggesting a pause or potential setup before the next significant move.
Key Levels:
Support: 1,726 (primary), followed by 1,680 and 1,620
Resistance: 1,910, with extended targets at 1,960 and 2,020
The 1,726 level serves as a critical pivot point, marking a previous consolidation zone. A pullback toward this level followed by a bullish rebound could reaffirm the uptrend and set the stage for a move toward the 1,910 resistance. A breakout above 1,910 would likely open the path to higher targets at 1,960 and 2,020 over the medium to long term.
On the other hand, a daily close below 1,726 would weaken the bullish structure and could trigger a deeper retracement toward 1,680 and potentially 1,620.
Conclusion:
ETH/USD remains in a bullish trend, but short-term consolidation may precede the next leg up. Traders should monitor the 1,726 support level closely—its defense could signal trend continuation, while a breakdown would increase downside risk.
This communication is for informational purposes only and should not be viewed as any form of recommendation as to a particular course of action or as investment advice. It is not intended as an offer or solicitation for the purchase or sale of any financial instrument or as an official confirmation of any transaction. Opinions, estimates and assumptions expressed herein are made as of the date of this communication and are subject to change without notice. This communication has been prepared based upon information, including market prices, data and other information, believed to be reliable; however, Trade Nation does not warrant its completeness or accuracy. All market prices and market data contained in or attached to this communication are indicative and subject to change without notice.

ETH is moving within the 1,755.00 - 1,860.00 range👀 Possible scenario:
Ethereum began a downward correction below $1,780 but is now consolidating around the $1,800 level. The price may attempt a breakout above $1,820, though resistance near $1,815 remains a key hurdle.
Meanwhile, whale accumulation is rising, and ETH ETFs saw their first net inflow in eight weeks—signaling renewed investor confidence. The Ethereum Foundation also announced leadership changes to strengthen strategic direction, naming Hsiao-Wei Wang and Tomasz K. Stańczak as co-executive directors.
✅Support and Resistance Levels
Support level is now located at 1,755.00.
Now, the resistance level is located at 1,860.00.

ETHUSD Short Set Up (28 April, 2025My SHORT Trend Continuation SET UP on ETHUSD. From price 1756.48 and I am anticipating that ETHUSD will reach the price 1557.76 where my target is.

Short-Term Trade Setup (30-min Timeframe) Date: 27/04/2025Entry Price: 1811.30
Target Price: 1786
Stop Loss: 1821
Trade Type: Short (Sell)
Disclaimer:
This trade idea is shared for educational and informational purposes only. It is not financial advice or a recommendation to buy or sell any asset. Trading involves substantial risk, and you should only trade with money you can afford to lose. Always do your own research or consult with a licensed financial advisor before making trading decisions.


Bet on ETH or SOL ?ETH vs SOL.
Which will outperform for the next year?
You really think ETH will just continue losing value against SOL?

srSupport and resistance analysis is a fundamental technique in technical trading used to identify price levels where buying or selling pressure has historically been strong enough to reverse or pause a trend. Support represents a price zone where demand tends to overcome selling pressure, preventing the asset from falling further. Conversely, resistance marks a level where selling interest outweighs buying pressure, capping upward price movement. Traders use these zones to anticipate potential price reactions, manage risk, and plan entry or exit points, recognizing that broken support can become new resistance and vice versa.

Ethereum Trade IdeaEthereum has broken out of it's ascending triangle pattern.
A possible retest of the triangle resistance levels which might turn to support.
If the level holds up that will be a begining of a new uptrend for Ethereum.


ETH/USD "Ethereum vs U.S Dollar" Crypto Heist Plan (Day/Swing)🌟Hi! Hola! Ola! Bonjour! Hallo! Marhaba!🌟
Dear Money Makers & Robbers, 🤑 💰💸✈️
Based on 🔥Thief Trading style technical and fundamental analysis🔥, here is our master plan to heist the ETH/USD "Ethereum vs U.S Dollar" Crypto Market. Please adhere to the strategy I've outlined in the chart, which emphasizes long entry. Our aim is to escape near the high-risk YELLOW ATR Zone. Risky level, overbought market, consolidation, trend reversal, trap at the level where traders and bearish robbers are stronger. 🏆💸"Take profit and treat yourself, traders. You deserve it!💪🏆🎉
Entry 📈 : "The heist is on! Wait for the MA breakout (1840) then make your move - Bullish profits await!"
however I advise to Place Buy stop orders above the Moving average (or) Place buy limit orders within a 15 or 30 minute timeframe most recent or swing, low or high level for Pullback entries.
📌I strongly advise you to set an "alert (Alarm)" on your chart so you can see when the breakout entry occurs.
Stop Loss 🛑: "🔊 Yo, listen up! 🗣️ If you're lookin' to get in on a buy stop order, don't even think about settin' that stop loss till after the breakout 🚀. You feel me? Now, if you're smart, you'll place that stop loss where I told you to 📍, but if you're a rebel, you can put it wherever you like 🤪 - just don't say I didn't warn you ⚠️. You're playin' with fire 🔥, and it's your risk, not mine 👊."
📍 Thief SL placed at the nearest/swing low level Using the 3H timeframe (1650) Day / Swing trade basis.
📍 SL is based on your risk of the trade, lot size and how many multiple orders you have to take.
🏴☠️Target 🎯: 2100 (or) Escape Before the Target
🧲Scalpers, take note 👀 : only scalp on the Long side. If you have a lot of money, you can go straight away; if not, you can join swing traders and carry out the robbery plan. Use trailing SL to safeguard your money 💰.
💰💵💴💸ETH/USD "Ethereum vs U.S Dollar" Crypto Market Heist Plan (Day / Swing Trade) is currently experiencing a bullishness🐂.., driven by several key factors.☝☝☝
📰🗞️Get & Read the Fundamental, Macro Economics, COT Report, Quantitative Analysis, Sentimental Outlook, Intermarket Analysis, Future trend targets... go ahead to check 👉👉👉🔗🔗
⚠️Trading Alert : News Releases and Position Management 📰🗞️🚫🚏
As a reminder, news releases can have a significant impact on market prices and volatility. To minimize potential losses and protect your running positions,
we recommend the following:
Avoid taking new trades during news releases
Use trailing stop-loss orders to protect your running positions and lock in profits
💖Supporting our robbery plan 💥Hit the Boost Button💥 will enable us to effortlessly make and steal money 💰💵. Boost the strength of our robbery team. Every day in this market make money with ease by using the Thief Trading Style.🏆💪🤝❤️🎉🚀
I'll see you soon with another heist plan, so stay tuned 🤑🐱👤🤗🤩

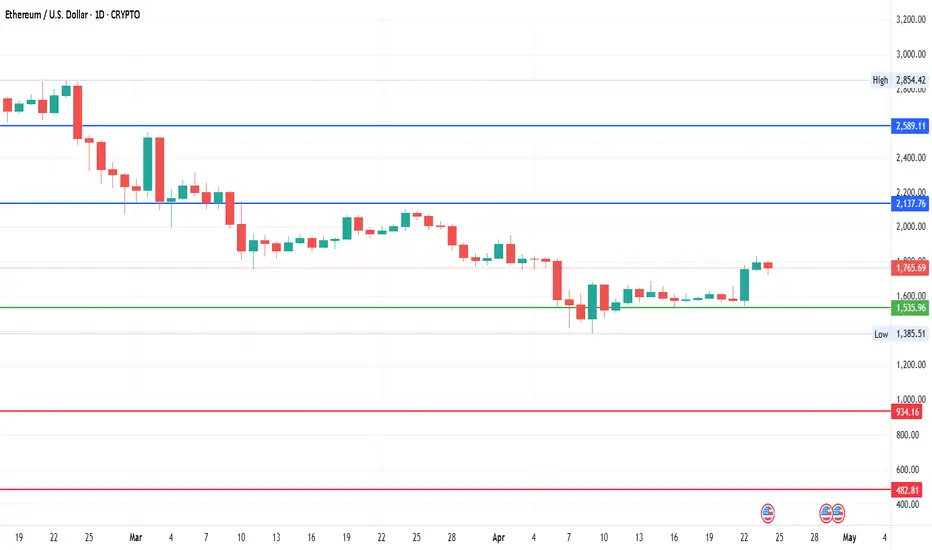
Ethereum - Looking GoodCurrent Price: 1772
Mid-point: 1535.96
Upside: 2137.76 & 2589.11
Downside: 934.16 & 482.81
Resistance: 1693.34 (It's already above this level at the time of posting).
Support: 1378.58
ETHUSD - IdeaCould the triangles be comparable?
With the first leading to a strong break out upwards
Have we hit the bottom of the next triangle?
I think these would be ascending triangles
Saw this chart or a similar version floating around and thought it would be a good post
Weekly timeframe


Ethereum (ETH) Buy Trade Setup 23/04/2025 09:08 AMEthereum (ETH) Buy Trade Setup
Entry: $1772
Target: $1860
Stop Loss: $1735
Risk-Reward Ratio: ≈ 2.38:1
🔔 Disclaimer:
This is not financial advice. The trade setup provided is for educational and informational purposes only. Always do your own research and consider your risk tolerance before entering any trade. Cryptocurrency markets are volatile and past performance is not indicative of future results. Trade at your own risk.

ETH Tests The $1,623 Level as SupportFenzoFx—ETH rebounded at the $1,623 support level, indicating potential for an uptrend toward $1,755.
If ETH/USD drops below $1,623, it may test the 50-period SMA near $1,600, aligned with the 50% Fibonacci retracement.
>>> No Deposit Bonus
>>> %100 Deposit Bonus
>>> Forex Analysis Contest
All at FenzoFx Decentralized Forex Broker

ETH/USD... Ethereum 1day chart pattern.✨ ETHUSD Trade Setup
Technical Analysis: Ethereum (ETH) has broken out of the descending channel, signaling a potential trend reversal. The MACD is showing bullish momentum, supporting a Buy signal.
Entry: 1,600
Targets:
Target 1: 2,100
Target 2: 2,800
Stop Loss: 1,399
Bias: Bullish
Confirmation: Channel breakout + MACD bullish crossover
---
Let me know if you want a chart image, a version for social media, or to track this trade over time.

$ETH Is Trapped in Bearsh Channel — Breakout Coming or More PainWhile Bitcoin has been stealing the spotlight, Ethereum ( CRYPTOCAP:ETH ) is quietly stuck in a bearish channel on the daily chart.
📉 Lower highs. Lower lows.
Price is respecting both the upper and lower bounds with precision.
🔍 What’s happening:
• Since December when price topped at $4,125 CRYPTOCAP:ETH started it's bearish move
• Volume is thinning = indecision
• ETH/BTC pair is underperforming
📊 Things to watch:
• A strong breakout above $1,790 with volume could flip the narrative
• Otherwise, we may go back to $1,400 or even current channel support at $1,000
Are you positioning for a breakout or shorting the range?
⚔️ Drop your ETH bias + chart if you have one. Let’s compare setups 👇

ETH buy tradeLooking for buy trade in eth once price moves to fvg and reverses in ltf with condirmationj bos

ETHUSD: Strong Bearish Sentiment! Short!
My dear friends,
Today we will analyse ETHUSD together☺️
The price is near a wide key level
and the pair is approaching a significant decision level of 1.576.0 Therefore, a strong bearish reaction here could determine the next move down.We will watch for a confirmation candle, and then target the next key level of 1.557.1..Recommend Stop-loss is beyond the current level.
❤️Sending you lots of Love and Hugs❤️

ETH Bullish trend change.After a very unexpected bearish ride for ETH, I am convinced we are having
a trend change to the upside for ETH. A bullish move to the upside
can happen quickly and make new highs.
Trade at own risk.. !

ETH Bottom soonEth never hit the ritualistic new ATH for the bull run cycle leading many to believe it is next in line to break its previous ATH to the upside of 4700.
However, given the current U.S. presidents reputation to do everything hard, and ETH's involvement with central banks, we are potentially due for a hard lading dip and rip scenario for ETH before it hits a new ATH. Here is the support arc I speculate to load up, and don't forget, double and triple bottoms make it more real.

Ethereum Trades Sideways Testing Critical Support FenzoFx—Ethereum trades sideways, unable to surpass $1,690 resistance. Currently, it hovers at $1,565, testing this level as support.
The bearish trend persists below $1,755. Stabilization under $1,565 may lead to dips toward $1,470 and potentially $1,370 if selling pressure increases.
>>> No Deposit Bonus
>>> %100 Deposit Bonus
>>> Forex Analysis Contest
All at F enzo F x Decentralized Forex Broker
