Ethereum Price Analysis: Range-bound with Potential Buy ZoneEthereum's price action remains within a defined range, recently moving from the top toward the lower boundary. A similar setup is observed in the ETH/BTC pair. This area may offer a buying opportunity, though confirmation of an uptrend on the daily chart is still required.
ETHBEARUSD trade ideas

A-typical rising wedge giving way to 1160 fib targetWhat looks like a triangle here is an accurate representation of the hopium surrounding ETH... But with consumer spending looking fragile, we won't see the bottom any time soon.

ETH to rise to between 2000 and 2200 area and fall 59% to 800Eth has dropped two levels from the top of around 4k. We are due a bounce up to around 2000 to 2200 area and complete the final drop which will drop us to £800 area.

(ETH) ethereum one day chart,. I confused the week chart setting for the day and found more optimism than there truly is. Still the line are converging and separating and creating time as a chart to distance oneself from reality only to get lost in the timeframes of trade.

(ETH) ethereum "triangle - slant"Ethereum is not priced for an only up direction as of right now, unlike Bitcoin. As seen in the chart and indicator. The pink and purple dotted lines are close to intersecting and if the pink link crosses over this is a good sign for the chance of a neutrality and even a possible upward forming price chart position.

Ethereum H4 | Heading into a pullback resistanceEthereum (ETH/USD) is rising towards a pullback resistance and could potentially reverse off this level to drop lower.
Sell entry is at 1,746.35 which is a pullback resistance that aligns with the 50.0% Fibonacci retracement.
Stop loss is at 1,980.00 which is a level that sits above the 78.6% Fibonacci retracement and an overlap resistance.
Take profit is at 1,436.95 which is a swing-low support.
High Risk Investment Warning
Trading Forex/CFDs on margin carries a high level of risk and may not be suitable for all investors. Leverage can work against you.
Stratos Markets Limited (tradu.com):
CFDs are complex instruments and come with a high risk of losing money rapidly due to leverage. 63% of retail investor accounts lose money when trading CFDs with this provider. You should consider whether you understand how CFDs work and whether you can afford to take the high risk of losing your money.
Stratos Europe Ltd (tradu.com):
CFDs are complex instruments and come with a high risk of losing money rapidly due to leverage. 63% of retail investor accounts lose money when trading CFDs with this provider. You should consider whether you understand how CFDs work and whether you can afford to take the high risk of losing your money.
Stratos Global LLC (tradu.com):
Losses can exceed deposits.
Please be advised that the information presented on TradingView is provided to Tradu (‘Company’, ‘we’) by a third-party provider (‘TFA Global Pte Ltd’). Please be reminded that you are solely responsible for the trading decisions on your account. There is a very high degree of risk involved in trading. Any information and/or content is intended entirely for research, educational and informational purposes only and does not constitute investment or consultation advice or investment strategy. The information is not tailored to the investment needs of any specific person and therefore does not involve a consideration of any of the investment objectives, financial situation or needs of any viewer that may receive it. Kindly also note that past performance is not a reliable indicator of future results. Actual results may differ materially from those anticipated in forward-looking or past performance statements. We assume no liability as to the accuracy or completeness of any of the information and/or content provided herein and the Company cannot be held responsible for any omission, mistake nor for any loss or damage including without limitation to any loss of profit which may arise from reliance on any information supplied by TFA Global Pte Ltd.
The speaker(s) is neither an employee, agent nor representative of Tradu and is therefore acting independently. The opinions given are their own, constitute general market commentary, and do not constitute the opinion or advice of Tradu or any form of personal or investment advice. Tradu neither endorses nor guarantees offerings of third-party speakers, nor is Tradu responsible for the content, veracity or opinions of third-party speakers, presenters or participants.

ETHUSDbuy ETHUSD now 1.609
sl 1,540
tp 1,803
going long still .
back to back trades
risk 1% each trade

Ethereum (ETH/USD) Analysis Summary – April 14, 2025Overview: The chart displays a bearish outlook for Ethereum (ETH/USD) based on technical price action. The current market price is around $1,584, with a potential bearish pattern developing after a series of lower highs and horizontal support tests.
Forecast: The projected price path suggests a short-term consolidation or minor bullish correction before a significant downward move, potentially forming a lower low.
🔻 Target:
$1,353.99
This is the projected take-profit level marked by the large green area at the bottom of the chart.
🔺 Stop Loss:
$1,678.63
This is the invalidation level for the bearish outlook, marked by the red zone on the upper side.
Technical Notes:
The chart appears to incorporate a head-and-shoulders-like pattern.
There's a breakdown from a trendline and repeated rejections at lower highs.
The pattern suggests potential for a drop toward the $1,350 zone if support around $1,500 fails.
📢 Disclaimer: This analysis is for educational and informational purposes only. It does not constitute financial advice or a recommendation to buy or sell any financial instrument. Always conduct your own research or consult with a licensed financial advisor before making trading decisions. Markets are volatile and trading carries risks.

Ethereum Bullish Breakout in Sight — Targeting 1911ETH/USD has shown a strong reversal from the 1564 support zone and is currently consolidating around the 1607 level. If the current bullish momentum holds, the next key resistance levels to watch are 1698, 1790, and ultimately 1911.
The chart indicates a potential breakout move toward 1911, provided price action sustains above the 1607 support. A successful hold here could trigger a strong upward rally through the upcoming resistance zones.
This setup suggests a bullish outlook for Ethereum in the short to mid term, as long as market conditions remain stable.
Note: This idea is for educational purposes only. Please do your own research before making any trading decisions.

ETH/USD Analysis - Consolidation with Potential BreakoutETH/USD is currently in a consolidation phase on the 1-hour chart, trading within a range between $1,602.5 (resistance) and $1,595 (support). The price has shown multiple tests of these levels, with recent long and short signals indicating potential breakout opportunities.
Technical Indicators:
This analysis uses the " Supertrend with EMA and RSI @tradingbauhaus " indicator:
• Supertrend: The price is oscillating around the Supertrend line (green/red), with recent signals flipping between bullish (long) and bearish (short).
• EMA (10, 50): The price is near the 50-period EMA, acting as dynamic support/resistance. A breakout above or below could confirm the next move.
• RSI (14): Not visible on the chart, but typically used in this indicator to gauge overbought/oversold conditions.
Key Levels and Signals:
• Resistance: $1,602.5 (recent high, marked with a short signal at -6).
• Support: $1,595 (recent low, marked with a long signal at +6).
• Entry (Long): A confirmed break above $1,602.5 could signal a long entry, with a recent long signal at $1,610.
• Entry (Short): A break below $1,595 could confirm a short entry, as seen with the recent short signal at $1,602.5.
• Stop Loss (SL): For longs, place below $1,595; for shorts, place above $1,602.5.
• Take Profit (TP): For longs, target $1,620; for shorts, target $1,580.
Conclusion:
ETH/USD is at a critical juncture, with the price testing a tight range. A breakout above $1,602.5 could signal bullish momentum, while a drop below $1,595 might favor bears. Watch for confirmation from the Supertrend and EMA alignment. What are your thoughts, traders?

ETHUSD, 4Hr, Long SetupETHUSD, 4Hr, Long Setup
TE: 150~1550
SL:1350
TP: 1900
BUT its all dependent on BTC as its dominance is going high and alts can follow BTC trend as well
CHOH occured on 4Hr

ETHUSD: Bears Are Winning! Short!
My dear friends,
Today we will analyse ETHUSD together☺️
The price is near a wide key level
and the pair is approaching a significant decision level of 1.582.3 Therefore, a strong bearish reaction here could determine the next move down.We will watch for a confirmation candle, and then target the next key level of 1.551.4..Recommend Stop-loss is beyond the current level.
❤️Sending you lots of Love and Hugs❤️

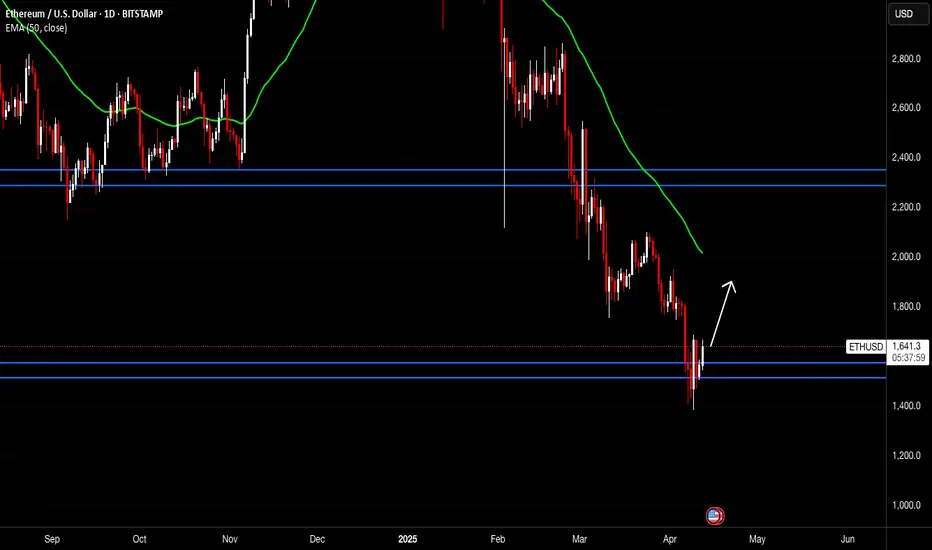
Ethereum (ETH/USD) Technical Analysis – Daily Chart (D1)
Method: Smart Money Concepts (SMC)
Date: April 13, 2025
🔍 Market Structure Overview
Current trend: Bearish
The chart clearly shows a sequence of Breaks of Structure (BOS) to the downside, indicating strong bearish pressure.
The latest Change of Character (CHoCH) occurred in early February 2025, marking a shift from accumulation/distribution into a downward phase.
🧠 Smart Money Concepts Highlights
Break of Structure (BOS)
Multiple BOS levels broken to the downside, confirming institutional selling activity.
The most recent BOS around $1,700 now acts as a key resistance zone.
Change of Character (CHoCH)
A confirmed CHoCH to the downside reflects a structural shift in favor of sellers.
Equal Highs (EQH) & Weak Low
The EQH has already been taken, indicating liquidity sweep above prior highs.
The Weak Low near $1,360 now becomes a likely downside target for smart money.
🧱 Key Supply & Demand Zones
Supply Zones (Resistance):
$1,950 – $2,300
$2,650 – $2,850
$3,100 – $3,500 (major EQH + distribution zone)
Demand Zone:
$1,360 – $1,300 (Weak Low and liquidity pool)
📉 Swing Trading Plan (Bearish Bias)
🔻 Potential Short Setup
Entry Area (Sell on Rally):
Price retracing into the $1,720 – $1,800 area (minor supply zone + previous BOS level)
Entry Confirmation:
Look for signs of bearish intent on the H4 timeframe:
Swing Failure Pattern (SFP)
Minor BOS
Bearish engulfing
Take Profit Targets:
TP1: $1,360
TP2: $1,280
Stop Loss (SL):
Above $1,850 (invalidates the bearish structure)
🔄 Alternative Bullish Scenario
A clean breakout and hold above $1,850 could indicate a CHoCH to the upside, potentially signaling a medium-term bullish reversal. However, the current structure remains bearish until proven otherwise.
📌 Conclusion
Bias: Bearish while price remains below $1,800
Strategy: Sell on retracement into premium zone
Confirmation: Look for SFP, BOS, or bearish PA on H4
Target Levels: $1,360 – $1,280
For full breakdown and SMC swing strategies, search: KepoinTrading on Google


ETH/USD Bearish Reversal Setup – Targeting $1,470 After ResistanPair: Ethereum / U.S. Dollar (ETH/USD)
Exchange: Coinbase
Timeframe: 15 minutes
Indicators:
EMA 30 (red line): ~1635.82
EMA 200 (blue line): ~1585.79
🟣 Key Levels & Zones
Resistance Zone (Purple Rectangle Top): Around $1,647 – previously tested and rejected.
Support Zone (Purple Rectangle Bottom): Around $1,470 – marked as the "EATARGET POINT".
Current Price: ~$1,645
📉 Bearish Breakdown Setup
Chart Pattern: There’s a potential double top or distribution zone forming near the resistance.
Projection: The price is expected to break below the smaller support zone and drop to the target zone around $1,470.67, representing an 11.13% drop.
Measured Move Tool: Indicates a bearish price target if the price breaks down from the current consolidation.
✅ Confluence
Price is currently hovering under resistance.
EMAs show short-term bullish momentum but could flatten if breakdown confirms.
Support near $1,635 is being tested – a break below could trigger the expected drop.
⚠️ Trading Implications
Short Setup: A trader might look to enter short around $1,647 if breakdown confirmation occurs.
Stop Loss: Just above the resistance zone (~$1,650+).
Take Profit: Near $1,470 zone.

$ETH update, are we at the bottom?We’re getting close.
If you’re still holding AMEX:ETH , you might just need a bit more patience — in a month, we could be heading back up.
Let’s break down the chart, because this is a fascinating setup:
1️⃣ Two similar patterns with three tops and three MACD resets.
2️⃣ AMEX:ETH is in a consolidation zone between $1950 and $1075, right where past rallies have started.
3️⃣ MACD on the weekly is near reset — a bullish reversal could kick in within 2 weeks and last 6+ months.
4️⃣ RSI is at the bottom, aligning perfectly with the MACD: this often signals a bounce.
📉 Yes, one last dip is possible — maybe $1150–$1250 — but I personally think AMEX:ETH will bounce above the previous low.
🚫 Don’t sell the bottom. Capitulating now could mean missing out on the reversal.
📅 Timeline? January was the time to exit. If you’re still in, just hold tight — things might look very different by May and beyond.
⚠️ Disclaimer: This is a chart-based analysis. Macro factors (👋 tariffs!) can shift everything, so stay alert and manage risk.

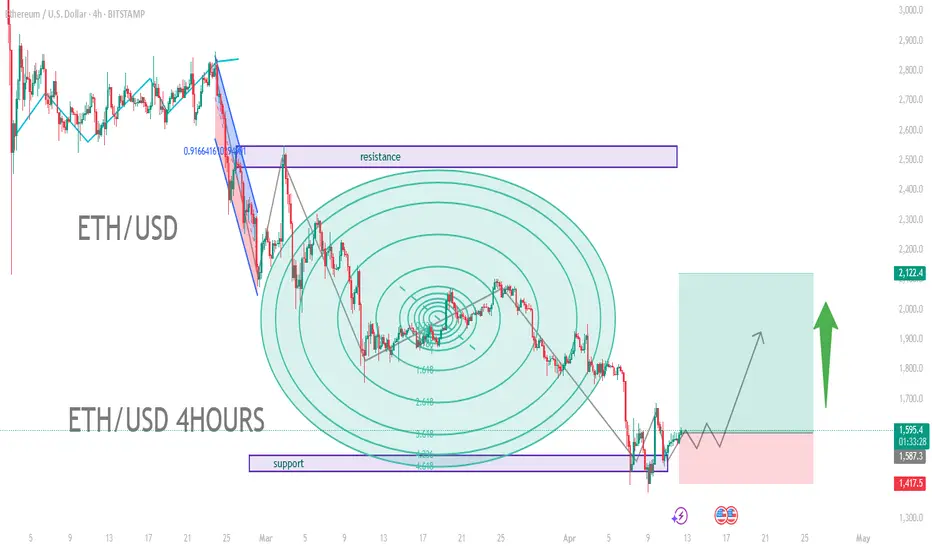
ETH) to U.S. Dollar (USD) A potential bullish reversal is indicaETH/USD (Ethereum vs. US Dollar)
4-hour chart, meaning each candle represents 4 hours of trading activity.
2. Key Chart Features
Support and Resistance Zones:
Resistance: A rectangular box near the $2,600 to $2,800 price zone. This area previously acted as a ceiling where price was rejected.
Support: A box near the $1,700–$1,750 region. Price has bounced off this area, suggesting a strong demand zone.
Fibonacci Circles:
These concentric circles are used to project potential support/resistance levels and timing based on Fibonacci ratios.
The price seems to be reacting near some of these circle lines, which are drawn from a major swing high to swing low.
Price Action:
There was a strong downward movement (highlighted in blue) followed by a consolidation.
A potential bullish reversal is indicated on the right, with a possible breakout to the upside shown by the green arrow and price projection box.
Risk/Reward Setup:
A long trade setup is illustrated:
Entry around $1,800
Stop loss near $1,417.5
Target around $2,100 or higher
This reflects a bullish outlook with an upward price trajectory.
3. Indicators and Tools Used
Fibonacci Retracement and Fibonacci Circles
Price Action Zones (Support/Resistance)
Projection arrows and rectangular zone for trade visualization
ETHUSDPrice looks to be having a reaction off the weekly and monthly support zone. Daily TF giving some sort of double bottom(line chart) and Wednesday closed with a bullish engulfing. Looking at 1,800 as 1st target and 2,300 as second target. Lets see what happens.

ETHSimple chart :
- Don’t fight the trend, just stick to your strategy.
- follow the signs.
- Never go all in and always DCA.
Only this way we will learn to master our emotions.
Happy Tr4Ding !

3k before august, is it real?Looking at history, ETH corrections of 65–75% have often been followed by sharp rallies. I believe we’re in a similar situation right now. With the upcoming Pectra upgrade on the horizon, there’s a strong chance we could see this pattern repeat.
At the same time, ETH is currently undervalued — not just against BTC, but also compared to many altcoins.
In my opinion, ETH is the most undervalued asset in the market right now.

Nice squeeze ETHWe're still in a negative trend from December, but as you can see the situation is becoming a squeeze, what happens often after this is, if the green indicator breaks this line, there is a good chance that the next consolidation will be around 2000
Normally when that happens, people react and buy because they think its going to continue, and this brings more liquidity to the market
its is what is called FOMO - fear of losing out, and it can affect the actual trajectory big time
causing it to continue its climb until no one has any more funds to put in
but looking at the previous years of Eth and whats been happening this year, its the lowest eth has been in three years at this time of year
its an indicator too that anyone who is actually interested in eth will get on board, because of these trend signs.
So what ever your ideas or choices, know that Eth has a very strong buying price point right now. It can't really get much better.

Bullish break or bearish breakTo me its bullish and quite tike the bears trying to find the way to reject it. If still in a buy becareful; be sure buy it at the right time..
So look if it breaks above 1,800 then it can go up to 2000 but it keeps the momentum to go higher then 3200 and lastly 4000. Baby steps; but if the rejects hits time after time and after time then possible will drop to 1250 or a little lower.
Lets see what happens
