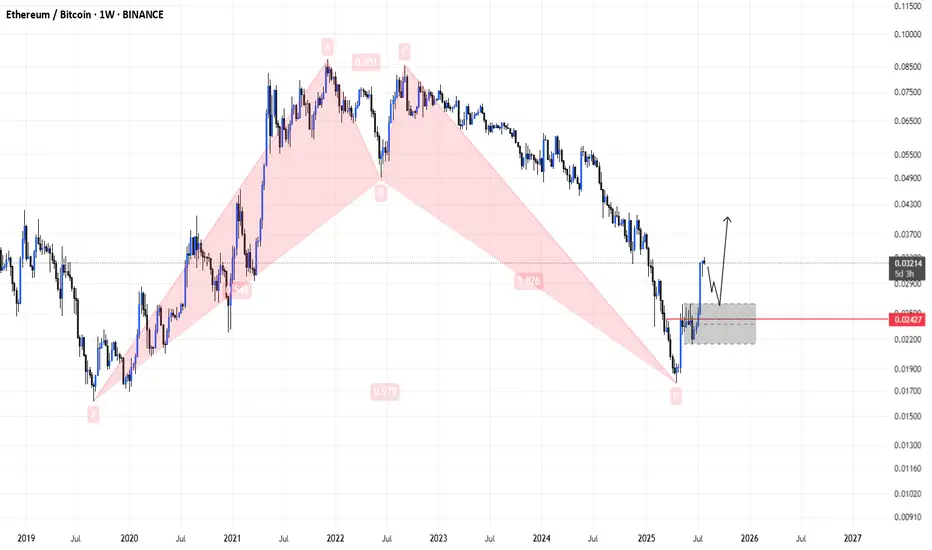
$ETH \ $BTC GONNA SEND INCOMING!The Ethereum-Bitcoin parity saw a local bottom after a long-term correction phase and began to move upward. The upcoming process will continue with a sharp upward trend.
Related coins

Eth/Btc✨ Ethereum vs Bitcoin — perhaps a new season is near...
📍 First week of August 2025
From the depths of a long, quiet downtrend,
Ethereum has risen from the 0.018 ~ 0.022 BTC zone...
Where unseen hands quietly caught the fall.
Now standing at 0.031 BTC:
RSI has regained strength, entering bullish

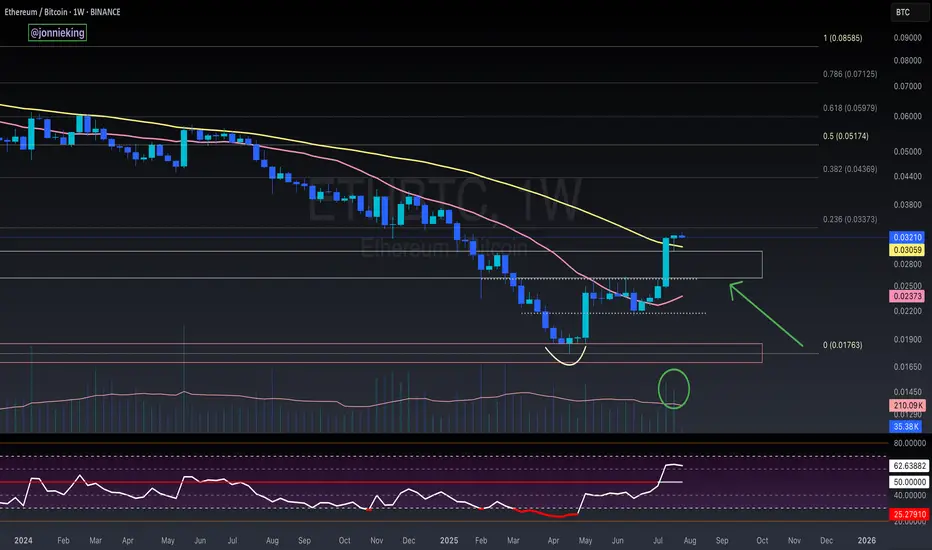
ETH/BTC Golden Cross Ignites
This is ETH/BTC on the daily chart.
The golden cross is now confirmed: 50MA has officially crossed above the 200MA.
Price reacted immediately, jumping straight to the 0.786 Fib level at 0.0347 a key resistance.
This confirms the bullish structure we’ve been tracking:
– Golden cross ✅
– Breakout

Ethereum Looks BullishThe weekly chart looks downright incredible. As discussed, ETH has finally broken bearish market structure and made a higher high, also breaking above the 50 MA for the first time in years. Now it has retested those levels multiple times as support and is outpacing Bitcoin, which is trading sideways

ETH/BTC: Golden Cross Reloaded?This is ETH/BTC on the daily chart.
A major event is about to unfold: the golden cross, where the 50MA crosses above the 200MA.
The last time this happened was in early 2020, around the same price zone, right after a bounce off the 2019 low double bottom and a rejection from the 0.5 Fib level, whic

ETH/BTCSince we had a massive break of weekly resistance on this pair...chances are that we might come back to visit previous resistance and test it as support...
Total Ethereum Dominance on the Market!🔚 July is coming to an end, and judging by the Monthly Return, it's safe to say that #ETH has outperformed BTC by a wide margin this past month. Yes, we saw something similar in May, but this time we finally have clear confirmations on the chart:
✅ ETH/BTC has broken out of a 4-year downtrend ;
✅ R

$ETH 2nd Weekly Close Above 50MA = Alt Season2nd Consecutive Weekly Close
above the 50MA for CRYPTOCAP:ETH
✅ Volume to confirm the breakout.
✅ RSI has bottomed.
WHAT TO WATCH 👀
┛Bullish Cross on the 20/50MA to confirm the next leg up.
┛Approaching some resistance ahead at the .236 Fib
┛Expect a small pullback in the next week or two so
ETHEREUM LOOKS AMAZINGYes, I continue to share ETH and largely ignore other altcoins. There’s a reason. When ETH outperforms, you can usually throw a dart to find other altcoins that are doing well - a rising tide lifts all boats.
Ethereum had an epic weekly retest of the 50 MA and previous resistance as support, befor

harmonic idea of eth/btc to up trend A harmonic idea for an ETH/BTC uptrend involves identifying specific **bullish harmonic patterns** on the ETH/BTC price chart. These patterns, like the Gartley, Bat, Butterfly, or Crab, are characterized by precise **Fibonacci ratio relationships** between their price swings (labeled X, A, B, C, D).

See all ideas
Summarizing what the indicators are suggesting.
Oscillators
Neutral
SellBuy
Strong sellStrong buy
Strong sellSellNeutralBuyStrong buy
Oscillators
Neutral
SellBuy
Strong sellStrong buy
Strong sellSellNeutralBuyStrong buy
Summary
Neutral
SellBuy
Strong sellStrong buy
Strong sellSellNeutralBuyStrong buy
Summary
Neutral
SellBuy
Strong sellStrong buy
Strong sellSellNeutralBuyStrong buy
Summary
Neutral
SellBuy
Strong sellStrong buy
Strong sellSellNeutralBuyStrong buy
Moving Averages
Neutral
SellBuy
Strong sellStrong buy
Strong sellSellNeutralBuyStrong buy
Moving Averages
Neutral
SellBuy
Strong sellStrong buy
Strong sellSellNeutralBuyStrong buy
Displays a symbol's price movements over previous years to identify recurring trends.