BTC to ETH - time comes to focus on etheriumBTC topped in a large five wave up rally against etherium
That means ETH should be outperforming BTC until we get a large A-B-C corrective structure hitting target 1 and target 2
ETHBTC trade ideas

$ETHBTC bottomalt szn starting?
CRYPTOCAP:ETH / CRYPTOCAP:BTC bouncing off the same level as it did before alts full sent in march '21?
btc.d failed to make a higher high
maybe, just maybe

BEARISH MOMENTUM DIEING OUT
ETHBTC seems like the Lux Algo is showing a bullish divergence with the Lux Algo showing a bottoming signal!!
This may be it!!


Where Ethereum Stands and The Best Time to BuyEthereum has essentially ranged the last year with large swings up and down. Major support rests at $2770 and upper resistance at $4700 with a current target of at least $13.6k.
While Ethereum has been ranging it's been falling against Bitcoin and like every bull cycle since 2017, Ethereum will be the last to catch up. But that time to buy is now and we can see major volumes have been hitting the Ethereum maket as eth/btc is in the buy zone below 0.031 with a target of 0.09. If bitcoin holds it's current support and runs to $174k in the coming months that puts Ethreum around $15.6k which is very close to my eth/usd target of $13.6k.
Aave market has 88% of all Ethereum on the platform (1.64M eth or $5.1 Billion) loaned out and sold short. There seem to be online wars of people fighting over why eth isn't on par with bitcoin. Ethereum futures has ATH open interest yet lending rates are near zero. These are all major signs of the end of the eth/btc bear market. We should see eth outperform btc this year. There's not much eth left to be sold short. I've never seen such reckless shorting of a crypto currency, but it's all fuel of the run up.


Ethereum’s Q1 Outlook: Fed’s Role in Shaping ETH’s FateEthereum (ETH) is navigating uncertain waters this Q1, with its price down 4% in January and nearly half of its "Trump pump" gains erased. Historically, Q1 has been a strong quarter for ETH, averaging +80% gains. Yet, the Fed's upcoming rate decision could heavily influence the token’s trajectory.
Crypto analyst Benjamin Cowen highlighted on X:
"One risk for #ETH is if the Fed comes out this week and says no QE, maybe that would cause ETH to finally go home on its USD pair, leading the Fed to reverse course in March 2025 causing a quick recovery."
Despite ETH’s historical strength in Q1, January 2025 might end in the red. February and March are typically pivotal months, with average gains of 20% and 22%, but ETH has had mixed results during these months since 2016.
Currently trading at $3.2K, ETH’s performance will likely depend on the Fed’s guidance. A rebound above the moving average could signal strength, but for now, the altcoin remains in a consolidation phase.
While historical data suggests the potential for a rally in February or March, ETH holders are watching the Fed closely. A dovish shift could reignite bullish sentiment, while hawkish policy might extend ETH’s struggles.
Q1 is shaping up to be a decisive quarter for Ethereum. Will the Fed’s actions spur a rally or further dampen the market?

ETH is lagging behing / Still holding BTC intead of ETH.Since 2022 Etherum has underperform BTC. We just broke a major trendline on the weekly.
We can expect more downside to more support level
At this stage, it is still better to hold BTC than ETH

Bullish Outlook for ETH: Buy Zone AnalysisEthereum (ETH) continues to establish itself within a favorable buy zone, indicating potential strength against Bitcoin in the near term. The buy signal generated by the Script Engine Profit suggests a significant upward move may be imminent. The chart outlines Targets 1, 2, and 3 as key levels to monitor for price action in the upcoming period.
Analysis conducted by TANIKING

ETH/BTC bottoming?It looks like ETH/BTC has hit bottom, but
If we want to look only at time, we have more time
We are at Q4 2020 prices...
Let's see

ETH/BTC At 2021 SupportJust a quick reminder that ETH has returned to 2021 vs. BTC. Do with this information what you choose, I am buying Ethereum.
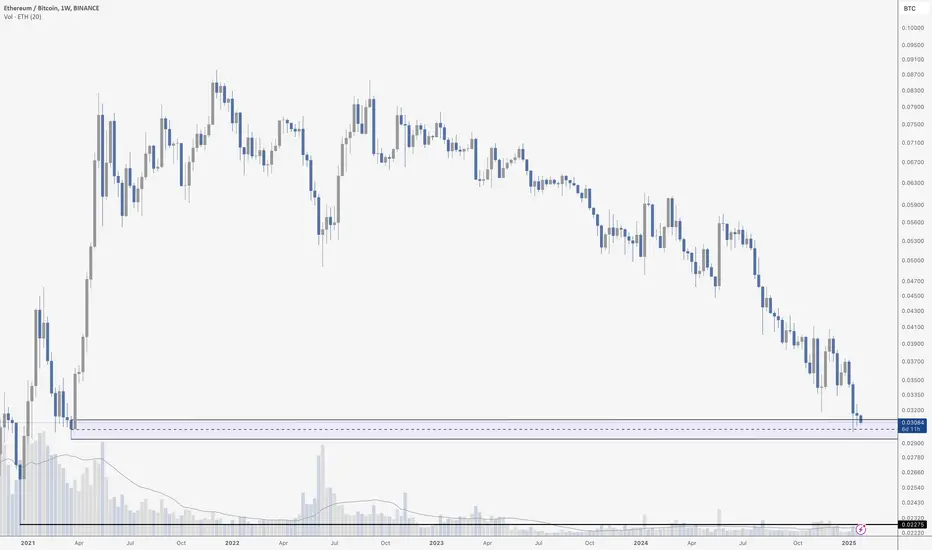
Analysis for ETH/BTC Pair:Support Zone:
The price is currently hovering near a significant historical support zone between 0.030 and 0.032.
This zone has previously acted as a major accumulation area, leading to upward moves in the past.
Potential Scenarios:
Bullish Case:
If the support zone holds and buying momentum increases, the price could begin to rebound.
The first target for an upward move is around the 0.048 level, aligning with a previous resistance zone and a key Fibonacci retracement area.
Beyond that, 0.075 could serve as the next major resistance if the bullish momentum persists.
Bearish Case:
If the support zone fails, a downward continuation could push the price toward 0.019.
This level aligns with historical lows and could act as the next significant support.
Market Structure:
The pair appears to be in a long-term downtrend, but the current consolidation within the support zone suggests a potential reversal or continuation decision point.
Key Levels to Watch:
Support: 0.030–0.032
Resistance: 0.048 (short-term), 0.075 (long-term)
Breakdown Target: 0.019
Trend Indicators:
Monitor the price action closely around the support zone. A strong bounce with volume could confirm a bullish reversal.
A breakdown below 0.030 with high selling pressure would indicate further downside.
Conclusion:
For Bulls: Focus on maintaining the support zone and breaking above 0.035 for confirmation of a reversal.
For Bears: Watch for a loss of the 0.030 support to target deeper lows.
Keep an eye on BTC dominance and overall market sentiment for further validation of these moves.


$ETHBTCclose above the 7ema or white squiggly to reclaim trend and attempt supply above
shall increase leverage once we reclaim yellow line above

ETH/BTC where is the bottom?You can see the same bottom levels on the RSI that we tested in 2019. It’s possible that this scenario will play out again this time, so I’ll be watching how the weekly RSI closes.

ETHBTC braekout 1h and 4h trendline, im waiting for new ATHETHBTC just breakout descending line 4h and 1h so im waiting for breaking 1day trendline.

ETHBTC Analysis - Time to buy ETH and its tokens?I can understand that the altcoins have lost all the gains, but we took as much profits as possible. ETHERUEM tokens have dropped massively but if u remember those were the coins we made most profit from. It really depends where in the market is your average buy level. Now for those who are trying to build a portfolio for long term knows that at these times, we accumulate good coins. ETHBTC chart is looking great, i expect Ethereum to move first followed by all its underlying tokens.
This chart shows we are in a demand level, which took a while to reach. After a very long time i can say I am bullish for Ethereum and its tokens to perform well.

ETH/BTC bottoming. It's Finally TimeIt's finally time for Eth/Btc to bottom. 2025 will be good to ETH even if it's not viable longer term. Look for Eth to outperform Btc over the coming months.

Eth/btc bullishSoon the beast will come out and will amaze us.
Eth/btc is going to find support at this region.
Alt season will start when eth starts breaking higher.

ETH BTC broke down the multi-cycle support trendline on HTFWe previously expected a reversal on multiple occasions, unsuccessfully each time. Last major prediction is visible in the chart (blurred). There were two major lines of support for ETHBTC, it broke the first one, then it bounced off the multi-cycle support line and we predicted the bottom at that stage and went long.
Unfortunately, that bounce was both short-lived and weak and ultimately it reversed all the bounce and broke down BELOW the multi-cycle support line for ETHBTC.
We will not be shorting this, but the long-time frame for ETHBTC is now in the bearish mode.
Potential key levels to watch are marked below.

Executive Order 5555.Trump DeFi Force (TDF) has issued your orders.
You have 1 year to comply.
All your technical analysis are belong to us.
#PulseChain

ETHBTC UPDATEA break of the last bottom would be very bad for eth and altcoins. We need to maintain the rate.

ETH/BTC Weekly Chart AnalysisThe ETH/BTC pair showcases a repeated pattern of breaking key support levels, followed by a price dump, and then a recovery rally that often targets the breakout level. Historical observations suggest the following behavior:
Key Chart Pattern:
Each major breakdown from horizontal support (marked with dashed lines) is followed by significant downward momentum.
After finding a bottom, the price tends to consolidate and stage a recovery rally, often revisiting the previous breakout point.
Bullish Divergence:
The RSI indicator at the bottom highlights bullish divergences (price forming lower lows, while RSI forms higher lows).
These divergences have historically signaled trend reversals and the start of a recovery rally.
Current Outlook:
ETH/BTC has once again broken support, with a bullish divergence forming on the RSI.
If history repeats, a potential recovery rally could see the price returning to the breakout level (~0.04), with a longer-term trajectory towards higher levels.
Key Levels:
Support: ~0.0315
Resistance: ~0.04, 0.06
RSI Levels: Watch for sustained movement above 37.5 for bullish momentum.
Conclusion:
This pattern could be a lucrative opportunity for swing traders, especially if the bullish divergence plays out as expected. Watch for a confirmed trend reversal before entering long positions.
