ETH-BTC Ethereum Elliott and Fibonacci structureThis study shows the Ethereum market against Bitcoin in terms of Elliott waves on a grid of Fibonacci trend lines generated from major price points of the market.
This highlights the distinctive triangular structure of trading for several years after the initial impulse of Ether to a Cycle high price.
Ever since printing the initial Cycle wave I, it has traded in a corrective pattern of a running flat with consistent internal 3-3-3 composition (ABC).
ETHBTC trade ideas

ETHBTC updateIt looks like the body of candles broke and closed the last level. Also, it looks like the next entry point for a buy for both ETHBTC would be where the impulse cleared liq. which lines up perfectly with the beginning of 2024. We'll see if its a bullish year for crypto. BUT it could also buy up hard and then dump hard to continue the bearish cycle.

ETH TO PUSH FOR TOP OF RANGE? Note the RSI breakout and retest.
Will this give Eth a shot at the upper range of the channel? Real question is will it break up or fail at the upper range? We’ll let the fans decide.
Good luck to all

ETH will outperform BTC
ETH/BTC pair forms a typical Accumulation schematic, following Wyckoff method.
In my analysis, it seems that ETH/BTC has likely reached its lowest point as the Spring event in phase C nears completion, paving the way for phase D and a potential acceleration to the upside. The primary obstacle seems to be the local trendline, but this shouldn't pose a significant challenge.
From a long-term perspective, I believe investing in ETH holds greater profit potential compared to BTC. However, this doesn't imply that an all-in approach on ETH is advisable. Diversification remains crucial in any investment strategy.
Disclaimer:
This analysis is based on my personnal views and is not a financial advice. Risk is under your control.

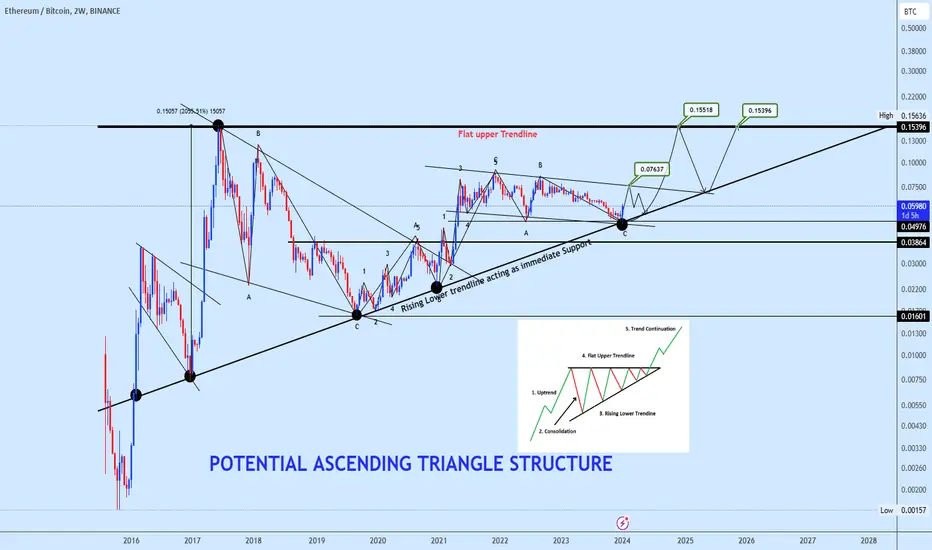
IS IT TIME FOR ETHBTC BREAKOUTLooks like ETH is finally ready to breakout against BITCOIN.
A 4 year long ascending triangle breakout is gonna melt faces when the breakout finally happens.
With a lot of factors helping the ETH narrative for the next coming months, a breakout is inevitable and it is gonna be a huge move. Highly bullish on ETH and all the L2'S of ETH.

Ethbtc trading opportunityETHBTC appears to be forming an ascending triangle pattern, traditionally seen as a bullish signal. We anticipate the price will ascend from the rising lower trendline, which has been providing robust support, towards the flat upper trendline, maintaining the rhythm of the pattern.
We've marked several key levels to monitor on the chart. Our current assessment is that the Neckline will hold, keeping the price movement contained within the triangle's boundaries.
We welcome you to share your perspectives with us, and if you find our analysis valuable, a like would be greatly appreciated.
ETH/BTC Levels to Pay AttentionThese are levels to pay attention in case ETH/BTC decides to make a move

BTCETH - We wait for what is to come!Dear my friends,
With the data I have from 2021. Only once did BTC price outperform ETH by 20 times. Then ETH regained its dominance. And BTC is only 11 times more than ETH.
Now, we again see BTC being 20x more than ETH. Indicators and resistance also indicate that history will repeat itself again.
I expect this, and we will have a mini altcoin in Q1. Then BTC will regain its dominance for a period that could last until the end of Q2 or 2024. And from there we There will be a real Altcoin season when ETH officially regains control and the real Altcoin season will begin.
Some sharing about predictions that I saw after looking at the BTCETH chart. Its similarity to the BTC.D chart makes me even more confident that this scenario will happen.
Best Regards,

ETHBTC- Can Rise Significantly Ethereum has been outshining Bitcoin recently, just as we anticipated. A significant breakout is looming on the Ethereum-Bitcoin chart, heralding what might be the beginning of Ethereum's rapid ascent, outpacing Bitcoin in the days, weeks, and even months ahead.
Following the Bitcoin ETF approval, analysts like James Safart from Bloomberg are now evaluating the potential for an Ethereum ETF. This speculation over an impending Ethereum ETF approval in May has sparked conversations about a potential parabolic rally for Ethereum and other altcoins.
Interestingly, Bloomberg Intelligence hints at a 70% likelihood of a spot Ethereum ETF's approval. The SEC's first verdict on the spot Ethereum ETF application is expected by May 23. This situation presents a classic "buy the rumor, ignore the news, and buy the next rumor" event.
Our track record on Ethereum speaks for itself. We accurately predicted short positions on Ethereum just before it hit $5,000 and again at $3,580. Moreover, in June 2022, we shared a perfect re-entry long on Ethereum at $960. Since then, we've provided three more solid entry points for Ethereum trades in the last 48 hours.
Looking at the Ethereum-BTC chart, our prediction was spot-on about Ethereum's rise preceding the Bitcoin ETF's approval. Currently, Ethereum shows support at $2,543, with initial targets at $2,921 and $3,269. Eventually, I foresee Ethereum reaching new all-time highs within the next 18 months.
For today, watch for the key levels: $538 support and $2,918 resistance. As always, we'll approach this step by step, so stay tuned for more insights.
One Love,
The FXPROFESSOR 💙
Links: www.theblock.co...her-price-surge?utm_source...
finbold.com/expert-o...r-spot-etf-approval/


Chart Pattern Analysis Of ETH/BTC
K4 break up K2 and the downtrend line under increased volume,
If the following candles keep the strong momentum and break up 0.056,
Or the following candles stand upon K3 and the downtrend line,
I will exchange more BTC to ETH.
And the stop loss set at the lower price of K2 or K3.

ETH/BTC flaunting a potential bottomETH/BTC flaunting a potential bottom
ETH/BTC bounces from the bottom of our box and is attempting to reclaim the 200 week SMA at present, also challenges diagonal overhead resistance.
This is a serious congestion zone & one has to wonder...are the lows in? A move above 0.065 would leave us with all three supports (200, long term diagonal and box base.
PUKA

ETHBTC Price Action ObservationsWe have the ETHBTC buy signal. We have some upside for ETH both in USD and BTC valuations over the next few weeks. Holding ETH will pay off. This is consistent with the past movements of ETH prior to the BTC halvings. We also have the macro potential ETH ETF event. Strong confluence of bullish events. I put my ETHBTC levels and projections on the chart.

$ETHBTC: Long term buy zone and monthly trendsEthereum vs Bitcoin has entered a yearly scale buy zone for a while now, there is also a quarterly range expansion bar buy zone to enter longs on retrace that is active around these parts...
These levels give actionable support areas to consider for potential reversals of the trend, together with low volume gaps in the volume distribution for the uptrend leg which I plotted in light green.
Time@Mode trend has been down in monthly scale for a while now, as I reported in my publication in related ideas, but it will eventually mean revert and reverse the recent decline in my opinion, given long term prospects for Ethereum being solid with the adoption of Eigenlayer and growth in the staking and DeFi markets that will come with it, as well as the prospect of an upcoming ETF for Ether, likely being approved by May or June.
There is one 13 months down trend that expires by the end of March and aims for 0.04171, and another signal that popped later on, which predicts a 14 month decline starting from June 2023, and extending until July 2024, with a target @ 0.03976 BTC per ETH.
Once these signals pan out, we can expect a mean reversion or reversal leg which will cause a move back to the start of the declines (circa 0.069-0.0720 at least, by March 2025, to August 2025, the latest...these moves could take less time to materialize as well, and lead to a full scale reversal and uptrend if Ethereum does outperform Bitcoin long term again. I'm not too sure of this, and rather expect mean reversion and volatile sideways action in the ratio.
We will know more soon enough, but it is possible the ETF approval triggers the last part of this bearish forecast to materialize quickly before reversing over time.
Best of luck!
Cheers,
Ivan Labrie.

Send laser eyes to zero with hasteWhat do you think happens when ETHBTC breaks the downtrend?
Just a joke?
I doubt it.

ETH/BTC compressionETH/BTC indicates a 7-year-long compression in value. Considering that ETH/BTC has recently held many supports, it could easily outperform BTC in the medium-term future — an outperformance of +40% or more, if it reaches a value near the peaks of 2021 and 2022. But if it were to break this long-term resistance, it could reach or surpass the all-time high.

Eth taking the lead until atleast mar 3. Bitcoin and Ethereum are gearing up for a moon mission, with Ethereum playing the captain and outperforming everything else in the cosmic race. The game has changed big time for these two digital astronauts: Bitcoin's got its fancy ETF spacesuit on, and Ethereum's about to suit up in one too. Cryptocurrency is turning into the ultimate inflation-fighting superhero, yet no one's spilling the tea on how it's giving the USD a run for its money. It's like we're all at a party celebrating the future of money, but still, insisting on paying the DJ with old-school cash. On my chart, you can see ETHBTC just humped above the 200sma. Rumor has it the ETF will actually pass mar. 3, and it could play out like a typical sell the news scenario. You better betcha I'll be buying the dip.

✴️ Ethereum [NYA]In this long-term chart Ethereum is trading above the 0.382 Fib. retracement support level.
This is a very strong and important level technically speaking because it relates to the entire action from September 2019 to present time.
If this level holds, this is obviously bullish.
If it fails, the bears get the upper hand.
Now, what do I see?
Seeing that lower highs have been popping up since December 2021, it is likely that this pair wants to go lower, this is just the bias based on this simple fact.
MA200 is trending up, strong.
This indicator works like a magnet and it can pull the price of a pair toward it.
Now, if support holds, the bulls can win but, it is likely that we will see a test of MA200 or 0.5 Fib.
This level here sits around 0.0522.
This is a long-term chart.
The MACD is trading below zero (bearish) and the RSI below 50 with a downward curve.
Namaste.

Near to the main target!Hi there!
So, after crucial level was broken our main target to the downside is almost ready!
Few upside targets are my expectation after if this will happen!
Good luck traders.

ETH/BTC Market Observation and ProjectionsETH/BTC chart indicates that we have some more ways to the downside in ETH BTC valuation. I will be accumulating under 0.045 level. We have a blood diamond on the weekly chart. If history repeat itself, it should take us down to the golden pocket zone below 0.045 level before gaining enough strength to go higher. This aligns with the BTC.D action in the near term as well. At CWL we like confluences that give us an idea around the ETH movement expectations. Not a financial advice. DYOR.


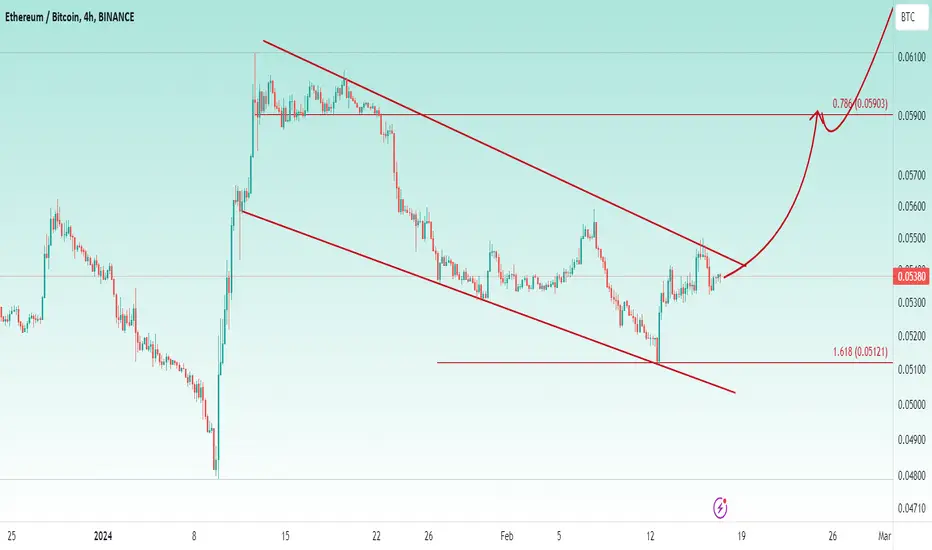
📈 ALT SEAON IS COMING👉 Clear Bull flag Formed At The Chart And The Price Exactly Bounced From The 0.051 As a 1.618% Fibo Level ,Breakout Is Possible To Happen Any Time
📥 When ETH/BTC Pair Is Bullish It Means Money Will Outflow From BTC To The ETH So ALT SEAON IS COMING