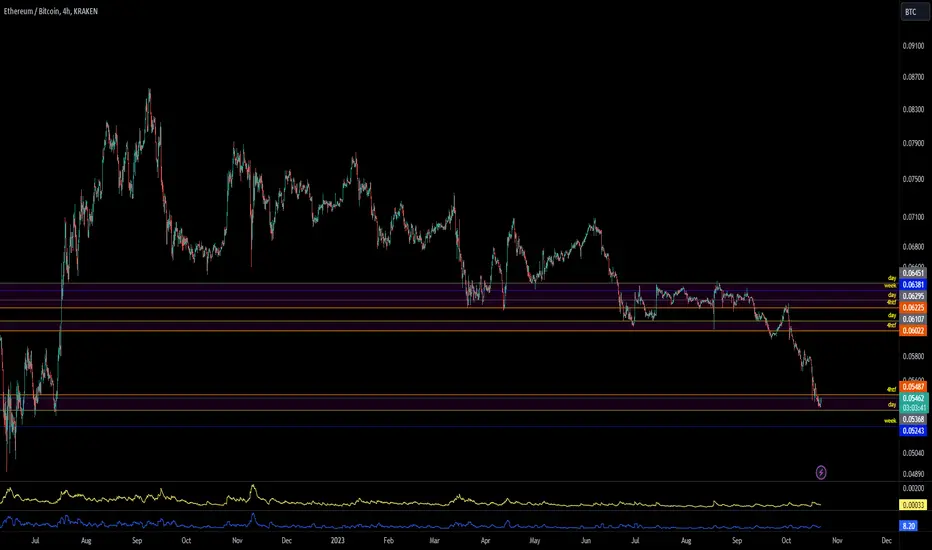
ethbtc-mentoringethbtc speculative view
looks like possibale long on lower TF
but weekley looks very bearish
overall market conditions also supports the downtrend idea
but short trades in bouth direction totally possibale
look for short if close under 5360 and rejects and close under weekly line
look for long if close above and holds 5487 area
***
Tolerance will reach such a level that intelligent people will be banned from thinking so as not to offend the imbeciles- F.M.dostoyevsky
ETHBTC trade ideas

Can ETH Outperform Bitcoin in the Next Bull Market?Potential Harmonic Pattern on the ETH/BTC Pair.
.....................................................................................................................
We are not registered or licensed in any jurisdiction whatsoever to provide investing advice or anything of an advisory or consultancy nature.
and are therefore are unqualified to give investment recommendations.
Always do your own research and consult with a licensed investment professional before investing.
This communication is never to be used as the basis of making investment decisions, and it is for entertainment purposes only.

Wyckoff Distribution schematic #2ETHBTC is showing signs of distribution. Volatility has recently increased, against the notion of absorption that would happen in a re-acummulation scenario. Besides, it has closed below the 200 MA.

ETH.BTC (Long Term Full Analysis)Hello Guys.
How are you?
I hope you are well.
let me say something frankly, it's NOT financial advice.
It's just a vision that belongs to me.
Please just see, think about that, and finally don't hesitate to write your comments.
Today I want to talk about ETHBTC
As you can see we are still in a bearish trend. because we always see a lower high in the chart.
First, I drew a trend line. As you can see, we had four hits on the trend line. It means this trend line is valid so much.
that's really amazing. it proves to us we can expect to see a reaction when the price touches this trendline.
That's really the best zone to buy ETH for the long term and hold.
I drew two support zones. the first one is around 0.04957 and it's really strong.
If you change the price from line to candle stick, you see there are four hits on the trend line.
So, this zone has the ability to push the price up.
although, I believe that the price will lose the first zone finally. Keep it secret, Please.
I'm waiting for the price to touch the second zone to buy ETH.
by the way, we have a flag, based on the flag's theory, when the price succeeds in breaking the low of the flag, A more optimistic approach would be to measure the distance in dollar terms between the pattern’s high and the base of the flagpole to set a profit target.
Also, we have a very positive reinforcement between this red trend line and the first green support zone.
This helps the price to stop dropping.
But if the price loses this zone, the next support zone will be active around 0.02688.
Let me tell you something different, I counted all the waves based on Elliot's rules. please pay attention to the below photo and tell me what you think.
I bet you can buy whatever you want at an amazing price. the rule of buying is being patient. and hold for the long term.
this is the main secret ...
Please don’t forget to write your comments ✍️✍️ Like 👍👍 and Share 👌👌 this Vision with your friends.
And tell me what do you think?
Do you agree with me or not?
Wish you health and success
Sincerely Yours
Ho3ein.mnD

ethbtc6 years triangle and 4 years parallel channel
this will be a wild move in favor of one, more...
energy of years ll be released...

ETH/BTC : Critical MomentETH/BTC has been trending downwards for over a year, and has now reached key support levels. Watch closely for a possible reversal within the zone, and act accordingly.
Fib Grid :
//Durbtrade

ETH / BTCETH broke the lower boundary of the formed triangle, which opens the way down to the 0.045 BTC target. There's also an uptrend line along the way, crossing at about 0.048 BTC.

ETHBTC po3 posibilityBINANCE:ETHBTC There is po3 occuring.If this pattern will reach its target.Alts will able to rise as well.USDT.D and BTC.D must be considered.

Warning to $ETH HODLERS | Watch out from a MSBBINANCE:ETHBTC is giving ETH HODLERS a warning sign with the failing wedge
Bear in mind that ETHBTC has not yet made the bear market capitalisation, where ETH lose 50%+ to BTC THE KING
I am a bitcoin only club member, but still own some dusts here and there
Pay attention when we break the market structure and close below the failing wedge 🏃♂️ 🏃♂️ 🏃♂️

ETHBTC Channel Down but how long before it takes off?The ETHBTC pair is trading within a Channel Down pattern on the 1W time-frame, with the 1W MA50 (blue trend-line) its key Resistance basically since the March 2023 sell-off. What's new though is that after this week's bearishness, it is approaching the 1W MA200 fast.
This coincides with the ETH's previous Bear Cycle bottom. That could be the test level before the price rebounds and really takes off breaking finally above that Channel Down. The current trend is bearish but you wouldn't want to bet on it too long.
-------------------------------------------------------------------------------
** Please LIKE 👍, FOLLOW ✅, SHARE 🙌 and COMMENT ✍ if you enjoy this idea! Also share your ideas and charts in the comments section below! This is best way to keep it relevant, support us, keep the content here free and allow the idea to reach as many people as possible. **
-------------------------------------------------------------------------------
💸💸💸💸💸💸
👇 👇 👇 👇 👇 👇

ETHBTC Possible Long Scenario ETHBTC possible Long Opportunity for long term.
Just need to wait for falling wedge breakout

Accumulate BTC with ETHHere is the game to play. ETHBTC is one of the less risky trades in the very risky crypto space. ETH and BTC are both long term winners (likely, not guaranteed). If I go wrong with this trade, I don't care, sooner or later the price will recover - no matter if I am in CRYPTOCAP:ETH or in $BTC.
Right now ETH is trading for 0.0587 btc. It has been dumping down to the upper band of the green demand zone. It might bounce here, but I am not sure - because of the magnetic attraction of the red trend line. A dump down to the confluence of the lower demand zone area and the red trend line followed by a reversal and increased volume would make me mid term bullish on ETH. I would sell some BTC for ETH and buy BTC back when ETH is back in the 0.07 btc zone.
NFA.

The ETH/BTC Chart is VERY INTERESTING RN!The ETH/BTC Chart is VERY INTERESTING RN!
• 3-year long channel bottom zone
• weekly untapped supply zone
don't over complicate things 🤡
Good times to exchange some BTC for ETH.

ETH - long positionHello my fellow traders, ETH / BTC chart looks like we could see a reaction from ETH soon. Range low is approaching and I am looking to get in long position in green box. I will wait for a reaction. If price bounce from green area I will share also ETH / USDT chart, when I get in long position.
Good luck.

Altseason on the Horizon? 🌕Exciting times are upon us in the world of cryptocurrencies! Ethereum (ETH) has recently broken out of a significant triangle pattern, and there's a compelling possibility that a similar pattern may soon emerge in the ETH/BTC pair. This development could signify the beginning of a mini altseason – an exciting prospect for crypto investors. 🎉
ETH's Triumph:
Ethereum's breakout from a long-standing triangle pattern has sent ripples through the crypto market. It's a bullish move that indicates renewed interest in the second-largest cryptocurrency by market capitalization. 📈
The ETH/BTC Pair:
Now, let's turn our attention to the ETH/BTC trading pair. Historically, altcoins tend to flourish when they outperform Bitcoin. A breakout of a similar triangle pattern in this pair could potentially signal a shift in market dynamics. 🔄
Implications for Altseason:
Here's why this matters: if Ethereum, often seen as a bellwether for altcoins, starts to outperform Bitcoin, it could mark the beginning of a broader altseason. During an altseason, many alternative cryptocurrencies (altcoins) experience significant price surges, presenting intriguing opportunities for investors. 🚀
Trading Strategy:
Keep an Eye on ETH/BTC: Watch for signs of a breakout in the ETH/BTC pair. Look for increased trading volume and clear confirmation of an upward trend.
Diversify Your Portfolio: If altseason does materialize, consider diversifying your portfolio to include promising altcoins that align with your investment strategy.
Stay Informed: Keep abreast of market news and developments that could impact cryptocurrency prices.
Conclusion:
While crypto markets are inherently volatile, technical patterns and market dynamics can provide valuable insights. Ethereum's breakout from the triangle pattern and the potential ETH/BTC breakout are exciting indicators.
Remember, cryptocurrency investments carry risks, so always exercise caution and perform thorough research before making any decisions.
Could this be the start of an altseason that leads to new opportunities and gains? Stay tuned, and let's see where the crypto journey takes us! 🌟
❗️Get my 3 crypto trading indicators for FREE! Link below🔑


ETHBTC VISION ELLIOTT WAVEHi everyone!
I want to share my vision on ETHBTC chart.
It can be doubts how to mark a global chart from the of Ethereum existance, but it is no doubts how to mark it from the middle of 2022.
Market made clear 5 impulse and I assume it as A wave
Then market was completing a complex correction as a wave B ( I can mark it either a descending triangle or WXYXZ ). AND I THINK IT HAD BEEN COMPLETED IN RECENT WEEKS
Now it is time for C wave that will consist its own 5 subwaves.
Upmove of ETHBTC will mean the power of ETH against BTC and hopefully the power of all Altcoin market.
Trade safe! Keep it simple and put your Risk Management first!
Sincerely


ETH/BTC - Flippening ... What Flippening ???My analysis of the ETHBTC chart suggests that there will be no Flippening, neither soon nor ever, an idea which I hope you will challenge with tough questions. After all, this venue exists to arouse the reverse-engineers and to provoke the thinkers to do what we do best.
As always, I strive to render these ideas of mine so obviously that their explanation will require no words, and this forecast is no exception.
Although my trading tactics - including the beauty of Tradingview and how it makes me look good - are based on identifying the opportunities within VOLUME, VOLATILITY and TREND EXHAUSTION, this is not a trade, per se, but the consummation of my understanding of the future of Ethereum as a "commodity".
Furthermore, I am preparing the charts of XRP/ETH and AMP/ETH as part of the complete analysis. Now that I have enough followers for live-streaming eligibility (many thanks!), I intend to do a recurring weekly show on prospecting within the cryptosphere, where those charts and others will be showcased regularly.
First, though, I have a few more ideas to upload as I update other key charts for the final Quarter of 2023.
Until then, be liquid !!!

ETHBTC 92123Still looking to pullback further to supports. If SUpports fail to hold it is going to get painful. This has been building for years. Bitcoin is King

