ETHBTC: Ethereum to gain massively against Bitcoin.Ethereum is overbought on its 1D technical outlook (RSI = 72.854, MACD = 228.230, ADX = 38.542) due to the rebound it initiated last week. Even though it is still on its very early stages, this rebound and statement of its strength is better viewed on the ETHBTC pair against Bitcoin. As you can see, ETHBTC bottomed on a level that it hasn't seen since January 6th 2020. The massive downtrend since 2023 is comparable to the one that started in 2018. Similar bottoms, similar 1W RSI sequences. We expect this rebound to be the main driver all the way to the 7 year Resistance level (R1). Traders of this pair can target 0.0800 on the long term.
## If you like our free content follow our profile to get more daily ideas. ##
## Comments and likes are greatly appreciated. ##
ETHBTC trade ideas

ETHEREUM push higher, previous push and FTX collapse connection
Anyone that knows me fully understands that I DISLIKE ETHEREUM A lot...Foe many reasons - So, please read this but understand, I am not going to paint many Rosey, Bright images about it....Mostly because there are NONE
For a start, the staking model giving Voting abilities DEPENDING ON HOW MUCH eth YOU HOLD..... is NOT decentralised Crypto
And the simple Fact that the American SEC refused to ever call ETHEREUM a Security while pointing its fingers at ALL others just leads me to feel that ETHEREUM is the Crypto of the American State...
Many think it was the 2nd Crypto to be released, the First ALT.
LITECOIN was the first..ETH arrived Late on the scene in 2013.
the ONLY thing that makes it 2nd is its Market Cap
SO, the Chart
The last Time ETH made a serious push was back in the middle of a BEAR market !
June 2022, while everything esle was dropping, dipping and crashing..... ETH made a push.
Suspicious from the start
With out to many details, FTX, another american Crypto "Baby" was likely responsible while manipulating the market as CZ from Binance stated at the time ( funny how the USA demanded he return and spend time in prison AT A LATER DATE huh )
Anyway, After this push, ETH Dipped sharply and recovered and then Ranged until the day that FTX collapsed.
And then look at what happened.
DROPPED while Every other Crypto in the world recovered some.
JAN 2023 - the beginning of the Recovery from a deep bear for crpyto.....
Except ETHEREUM - iT DROPPED AS MOST PEOPLE IN THE KNOW UNDERSTOOD JUST WHAT eth IS.
And now, With the President Trump Crypto loving American Dream coming alive, ETH decides to wake up after a Long Sleep....Why now ? Why not earlier ????
AND I STILL DO NOT TRUST IT
You can buy it, trade it, Just do not hold it is my opinion.
And it is at 54% right now...
Can it go higher ?
All depends on what the next phase of the USA CRYPTO DREAM has in store.
ETH last push in 2022 was 64% then ranged while being manipulated.....
Smells the same to me
BUY BITCOIN - HOLD BITCOIN
TRULY DECENTRALISED

ETH/BTC Macro Setup — Capitulation or Generational Buy?🧠 Analyzing the ETHBTC pair on the weekly timeframe, we’re potentially witnessing the final leg (Wave 5️⃣) of a massive Elliott Wave correction, aligning with historical reversal zones.
🔢 Wave Count Breakdown:
1️⃣ Initial crash from the 2017 cycle top.
2️⃣ Relief rally in 2018 (classic lower high).
3️⃣ Double-bottom accumulation near 0.017.
4️⃣ Blow-off top and 2021 euphoria.
5️⃣ Current leg — possible final flush to 0.013–0.010 zone.
⸻
📍 Key Zones to Watch:
• Immediate resistance at 0.030–0.034 — expect rejection here if price can’t break with volume.
• Target accumulation zone: 0.01348 to 0.01050 (Order Block from 2019).
• Ultimate fear zone: 0.00520 — a true black swan but unlikely unless BTC dominance spikes hard.
💥 Potential Scenarios:
🟢 Bullish Reversal: Price sweeps the lows, reclaims 0.013+, and begins a multi-year ETH outperformance.
🔴 Bear Continuation: Breakdown below 0.0060 = ETH underperformance for the foreseeable future.
⸻
💬 What It Means:
This is a macro opportunity. ETHBTC near 0.013 has historically signaled powerful altcoin seasons. We’re watching for:
• Bullish divergence.
• Structural reclaim above local resistance.
• Confirmed wave 5 completion.
📉 Current Price: 0.0252
📅 Timeframe: Weekly
🧠 Sentiment: Accumulate with caution — risk-reward is setting up favorably for long-term ETH believers.

ETH/BTC bear market since 2021.. bounce time ?ETH / BTC
If you checked this chart you will notice that ETH was in downtrend and bear market against BTC since 2021 !
Now we have reached a very important multi years support (price action on 2020 - 2019 - 2016 )
Time for bounce soon ?

ETHBTC – Bottom Likely In!Finally stepping in to say it—ETHBTC has likely bottomed.
April marked the final month of its bearish phase, and it just tapped the impulse zone from the last major move, which also lines up with a key range low we haven’t seen since December 2019.
The weekly is starting to show early signs of strength, adding weight to this being a pivotal area.
From a risk/reward standpoint, this is arguably the best BINANCE:ETHBTC setup in a long time.
Time to act accordingly—this could be the moment many have been waiting for. I expect BTC dominance to give alts some room over the next couple of weeks. The real test comes in July.
MARKETSCOM:ETHEREUM BINANCE:ETHUSDT

ETH / BTC Breakout ConfirmedExpect ETH to lead Bitcoin in the near term as the trend has finally reversed on a HTF.
Hopefully this is a sign of a proper Alt season inbound...

Capital FlowETH's breakout against Bitcoin is a strong indicator that capital is slowly flowing out of BTC into altcoins, which could eventually trigger a full-blown altseason.
Watching ETHBTC for a Double Bottom (Hidden Bullish Divergence)Introduction
We are in the initial stages of seeing if ETH can set a "higher low" double bottom on the monthly chart. The first low was set September 2019 so this has been a multi year pattern. It might be playing out over several crpyot cycles to completion.
Simple Price Analysis
For a valid double bottom we want the lows within 10% of each other. The first low is about 8% below this second low so we are definitely within tolerance. We can also see that price is currently bouncing off top of the previous monthly bottoming structure until price moved to between the 0.618 level and created a double top (which I covered extensively in the linked idea.
In the chart below we can see a similar pattern with bitcoin after the C19 crash. The low wasn't textbook, the first low being 18% lower than the second low. Thats fine. The most important think is that price set a higher low.
Targeting off the fib draw is still the same. Looking for the 1.618 level. So I am watching to see eth hit a 27x against bitcoin from here
Indicators
Normal Divergence (Trend Reversal)
Bearish: Higher highs on price action but lower highs on the indicator
Bullish: Lower lows on price action but higher lows on the indicator
Hidden (Trend Continuation)
Bearish: Lower high on the price action and higher highs on the indicator
Bullish: Higher low on the price action and a lower low on the indicator
If you look at the primer we are looking for the main trend to continue. And that is up.
Battle Plan
In my linked idea I made it clear I was staying out of eth until I saw bullish divergence. Not just eth, but everything in the eth ecosystem. Now EHTBC provisionally bullish its time to look at the ETH ecosystem again. While ETHBTC looked bearish I didn't even bother to analyze tokens against eth, only BTC.
Now I am going to be analyzing coins bullishness against eth. If I don't think it will outperform eth I don't buy it. And generally, I hope to be buying bull backs. Here is a great opportunity for a SUI buy when compared against eth on the 4h chart.
Wish me luck.
Linked Idea

ETH/BTC Retest of 2019 BottomSometimes all it takes is zooming out to look at the obvious support and resistance levels. ETH/BTC have been trading at this 2019 low for a couple of weeks now. It was more likely than not that we'd see the pump we are seeing over the last 2 days. Keep that in mind next time!

ETH/BTC Potential Bottom Forming, but Lacking Vol ConfirmationYeah, it could be a nice bottom — I see support around this area. The last time it reached this price was in December 2019 and May 2020. But if we look at the EMAs, they’re still well above. These days, I also trade based on volume, and in this case, we don’t see the same high volume we had back in 2019.

Eth btc idea Same support as 2020 lows . No way this scam keeps going lower I think alt season starts today . Let’s see the coming weeks how the market treat alt coins.

Is the Ethereum / Bitcoin bottom In?Eth maxi's have been obliterated for the past six - eight months, as a new all time high proved to be elusive. If you're a trend trader, this may be an interesting set up to watch...
Ethereum about to take the lead during the next leg up in the Crypto markets?

ETHEREUM PECTRA Coming into reality (LONG)Together, the community has nicknamed this combined upgrade "Pectra" (Prague + Electra). It’s the next major milestone after the Dencun upgrade and is expected to bring important improvements like:
EIP-3074: To improve wallet functionality and user experience.
EVM Object Format (EOF): A major upgrade to the Ethereum Virtual Machine.
More withdrawals and staking improvements.
Possible early preparations for Verkle Trees, a step toward Ethereum's long-term scalability roadmap.

ALERT: ALT SEASON INCOMING? 🚨 ALERT: ALT SEASON INCOMING? 🚨
Take a close look at the BTC/ETH chart — we’re seeing early signs of a major rotation out of Bitcoin and into Ethereum and altcoins. Historically, when the BTC/ETH ratio starts to fall, it's a clear signal that capital is flowing into altcoins, marking the beginning of alt season.
🔍 The ratio is showing bearish divergence and approaching a key support zone. If this level breaks, ETH is likely to outperform BTC significantly — and we all know what follows: altcoins explode.
📉 BTC dominance is stalling, ETH gaining strength, and altcoins are waking up. The market is shifting. Don't get caught late.
🚀 Get ready. The alt season might just be starting now.
#AltSeason #Crypto #BTC #ETH #TradingView #CryptoTrends

ETH Comeback ? Get the Champagne Ready ...Hello Traders 🐺
Hope you're all doing well.
Let me be honest with you — when I first looked at this chart, I thought:
“This could be the reversal we've been waiting for over the past two years!” 🔥
So please, take this setup seriously. If you manage it wisely, it could offer a highly profitable opportunity 👀📈
⚙️ What’s happening?
On the chart, we clearly see a bullish divergence on the RSI — and that’s always the first signal worth paying attention to.
These divergences usually indicate that bearish pressure is fading, and it's time for the bulls to take over 🐂
But that's not all…
This potential reversal is forming right above one of the most significant historical support zones on the ETH/BTC chart — a massive confluence.
And as you know:
"The higher the time frame, the more meaningful the level."
chart :
🎯 Price Targets:
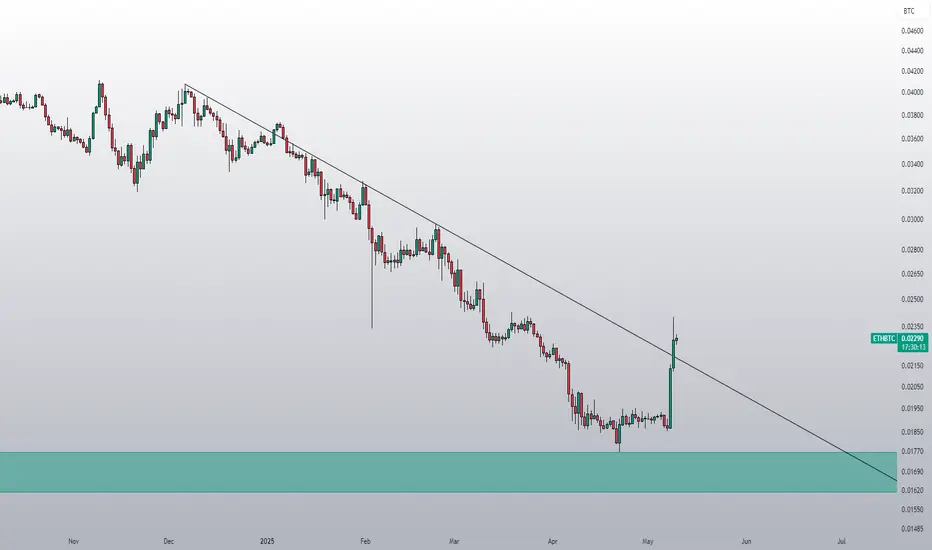
On the 4H chart, after a clean bear trap, ETH/BTC started to bounce back and is now testing the neckline resistance at 0.01930.
If we see a breakout here, the next price targets are:
Previous local high at 0.02028
And a short-term target around the red resistance box near 0.02137
This setup could mark the beginning of a new Altseason — or at least a strong ETH-led rally.
So act accordingly, manage risk, and as always:
🐺 Discipline is rarely enjoyable, but almost always profitable. 🐺
🐺 KIU_COIN 🐺

People can't imagine what's coming...The last time the monthly MACD for ETHBTC made a bullish cross, ETH went from around $175 to almost 5k. At that time the monthly RSI for ETHBTC was at 46. Now it is at 24 and the monthly MACD is still trending downwards but could turn anytime. Glorious times ahead! No financial advice!
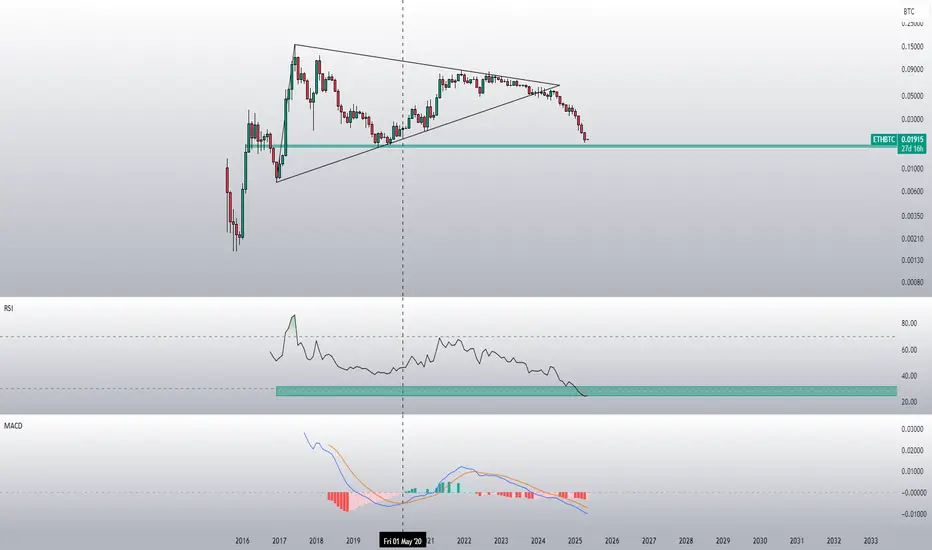
The smell of Altseason...The weekly RSI for ETHBTC is the lowest it has ever been. I expect one last liquidity grab at 0.01615 before the tide turns. No financial advice.

ALERT: ALT SEASON INCOMING? 🚨 ALERT: ALT SEASON INCOMING? 🚨
Take a close look at the BTC/ETH chart — we’re seeing early signs of a major rotation out of Bitcoin and into Ethereum and altcoins. Historically, when the BTC/ETH ratio starts to fall, it's a clear signal that capital is flowing into altcoins, marking the beginning of alt season.
🔍 The ratio is showing bearish divergence and approaching a key support zone. If this level breaks, ETH is likely to outperform BTC significantly — and we all know what follows: altcoins explode.
📉 BTC dominance is stalling, ETH gaining strength, and altcoins are waking up. The market is shifting. Don't get caught late.
🚀 Get ready. The alt season might just be starting now.
#AltSeason #Crypto #BTC #ETH #TradingView #CryptoTrends

Alt season is here ! I have done an analysis on ETHBTC vs BTCUSD which has consistently predicted the phases when altcoins do well. This is only when there's liquidity in the system and thus, even the broader stock market does very well.

ETHBTC - it's readyhi traders,
Let's have a look at ETHBTC chart on the weekly time frame
ETHBTC has been in a downtrend for almost 3 years.
The price came back into the support area that hasn't been tested since 2019.
Last time when RSI was at 24, ETHBTC bottomed out.
I can't see the price going much lower.
In my opinion, it's a great spot to buy ETH and just hold it for the next few months.
Do you agree? Feel free to share your thoughts in the comment section.

ETH/BTC Looking Juicy ...Well... not a bad time to scoop some ETH at these low levels for some long term hold...
As always, DYOR!
Peace,
Subawu

ETHBTCETHBTC
been waiting this place for years, finally we here
It's just an idea please don't take it serious
eth is for cyborg

ETHBTCi am waiting explotion after open usa stock market.we are getting to end For ETH.
If there will no wick for altcoins then it means that there is just a way which is up :) Lets Gooo
