FX-DiariesJul 30ETHBTC Doesn't matter what people say the bottom is in. ETH will outperform bitcoin, go long ETH is the best play now
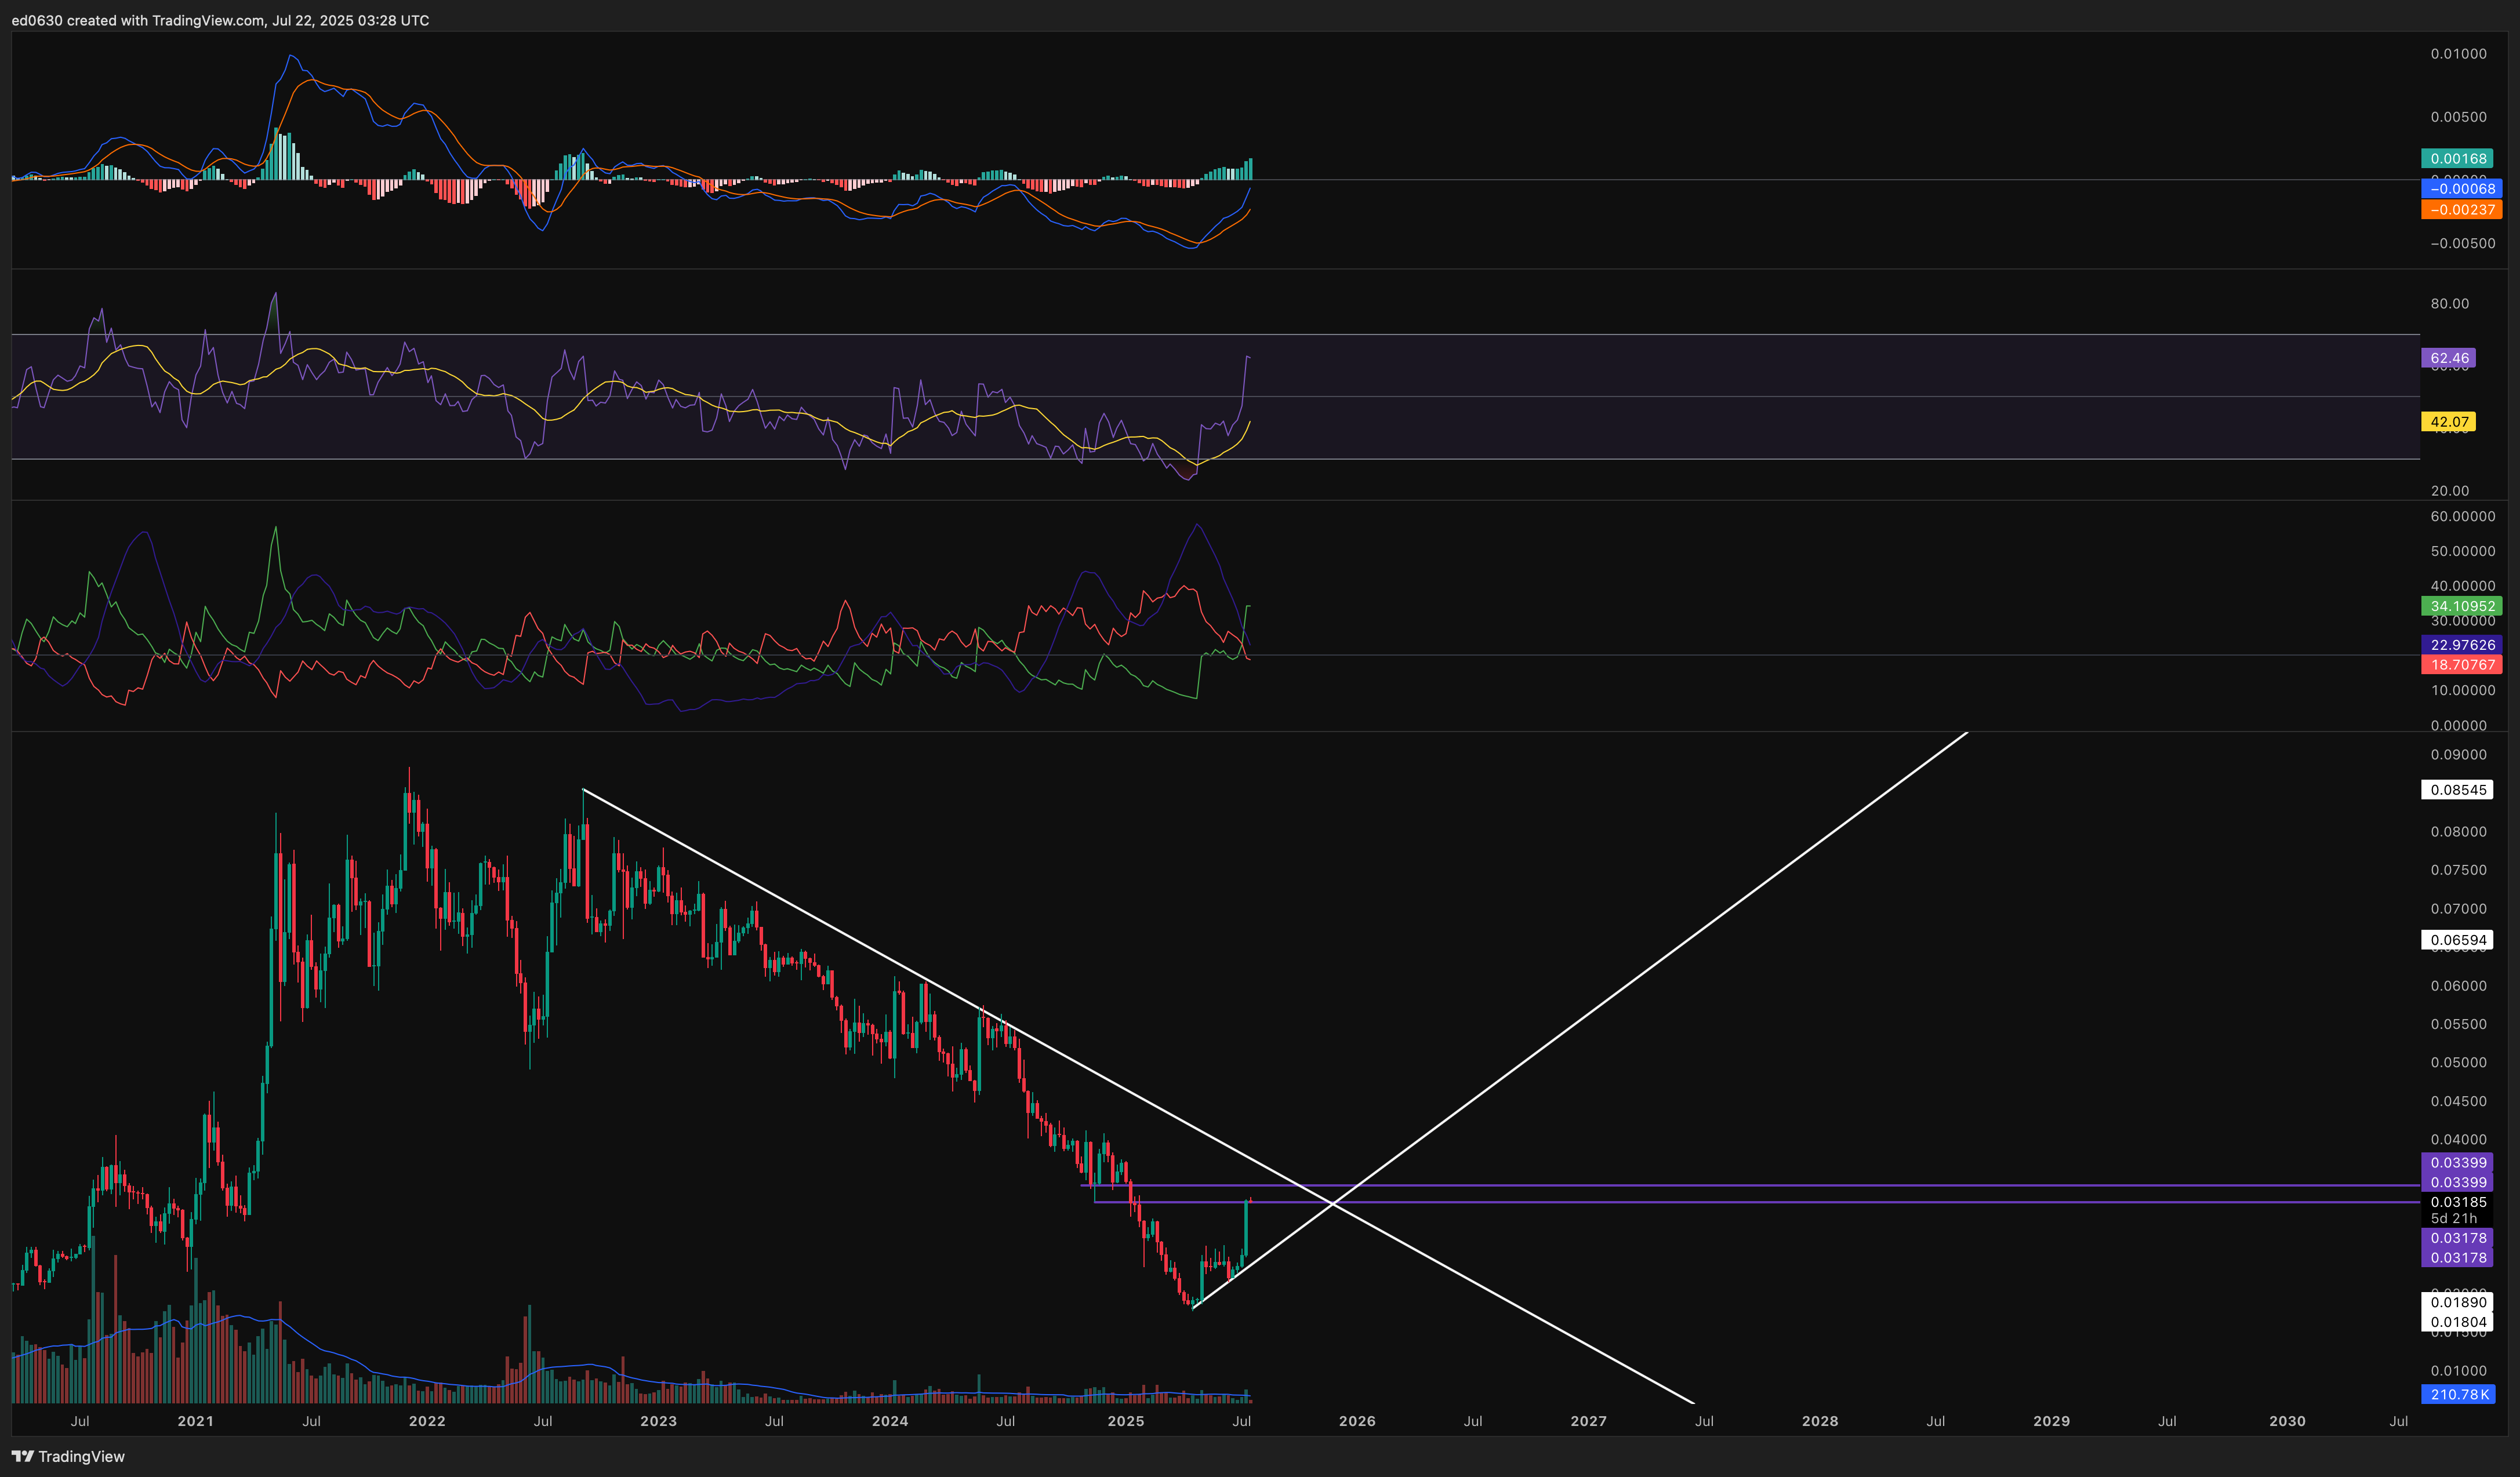
LiamB15Jul 16ETHBTC Watching for 2 green weekly closes above the 21W ema since Sept of 2022. This is the strongest ETH/BTC move we've seen in almost 2 years!
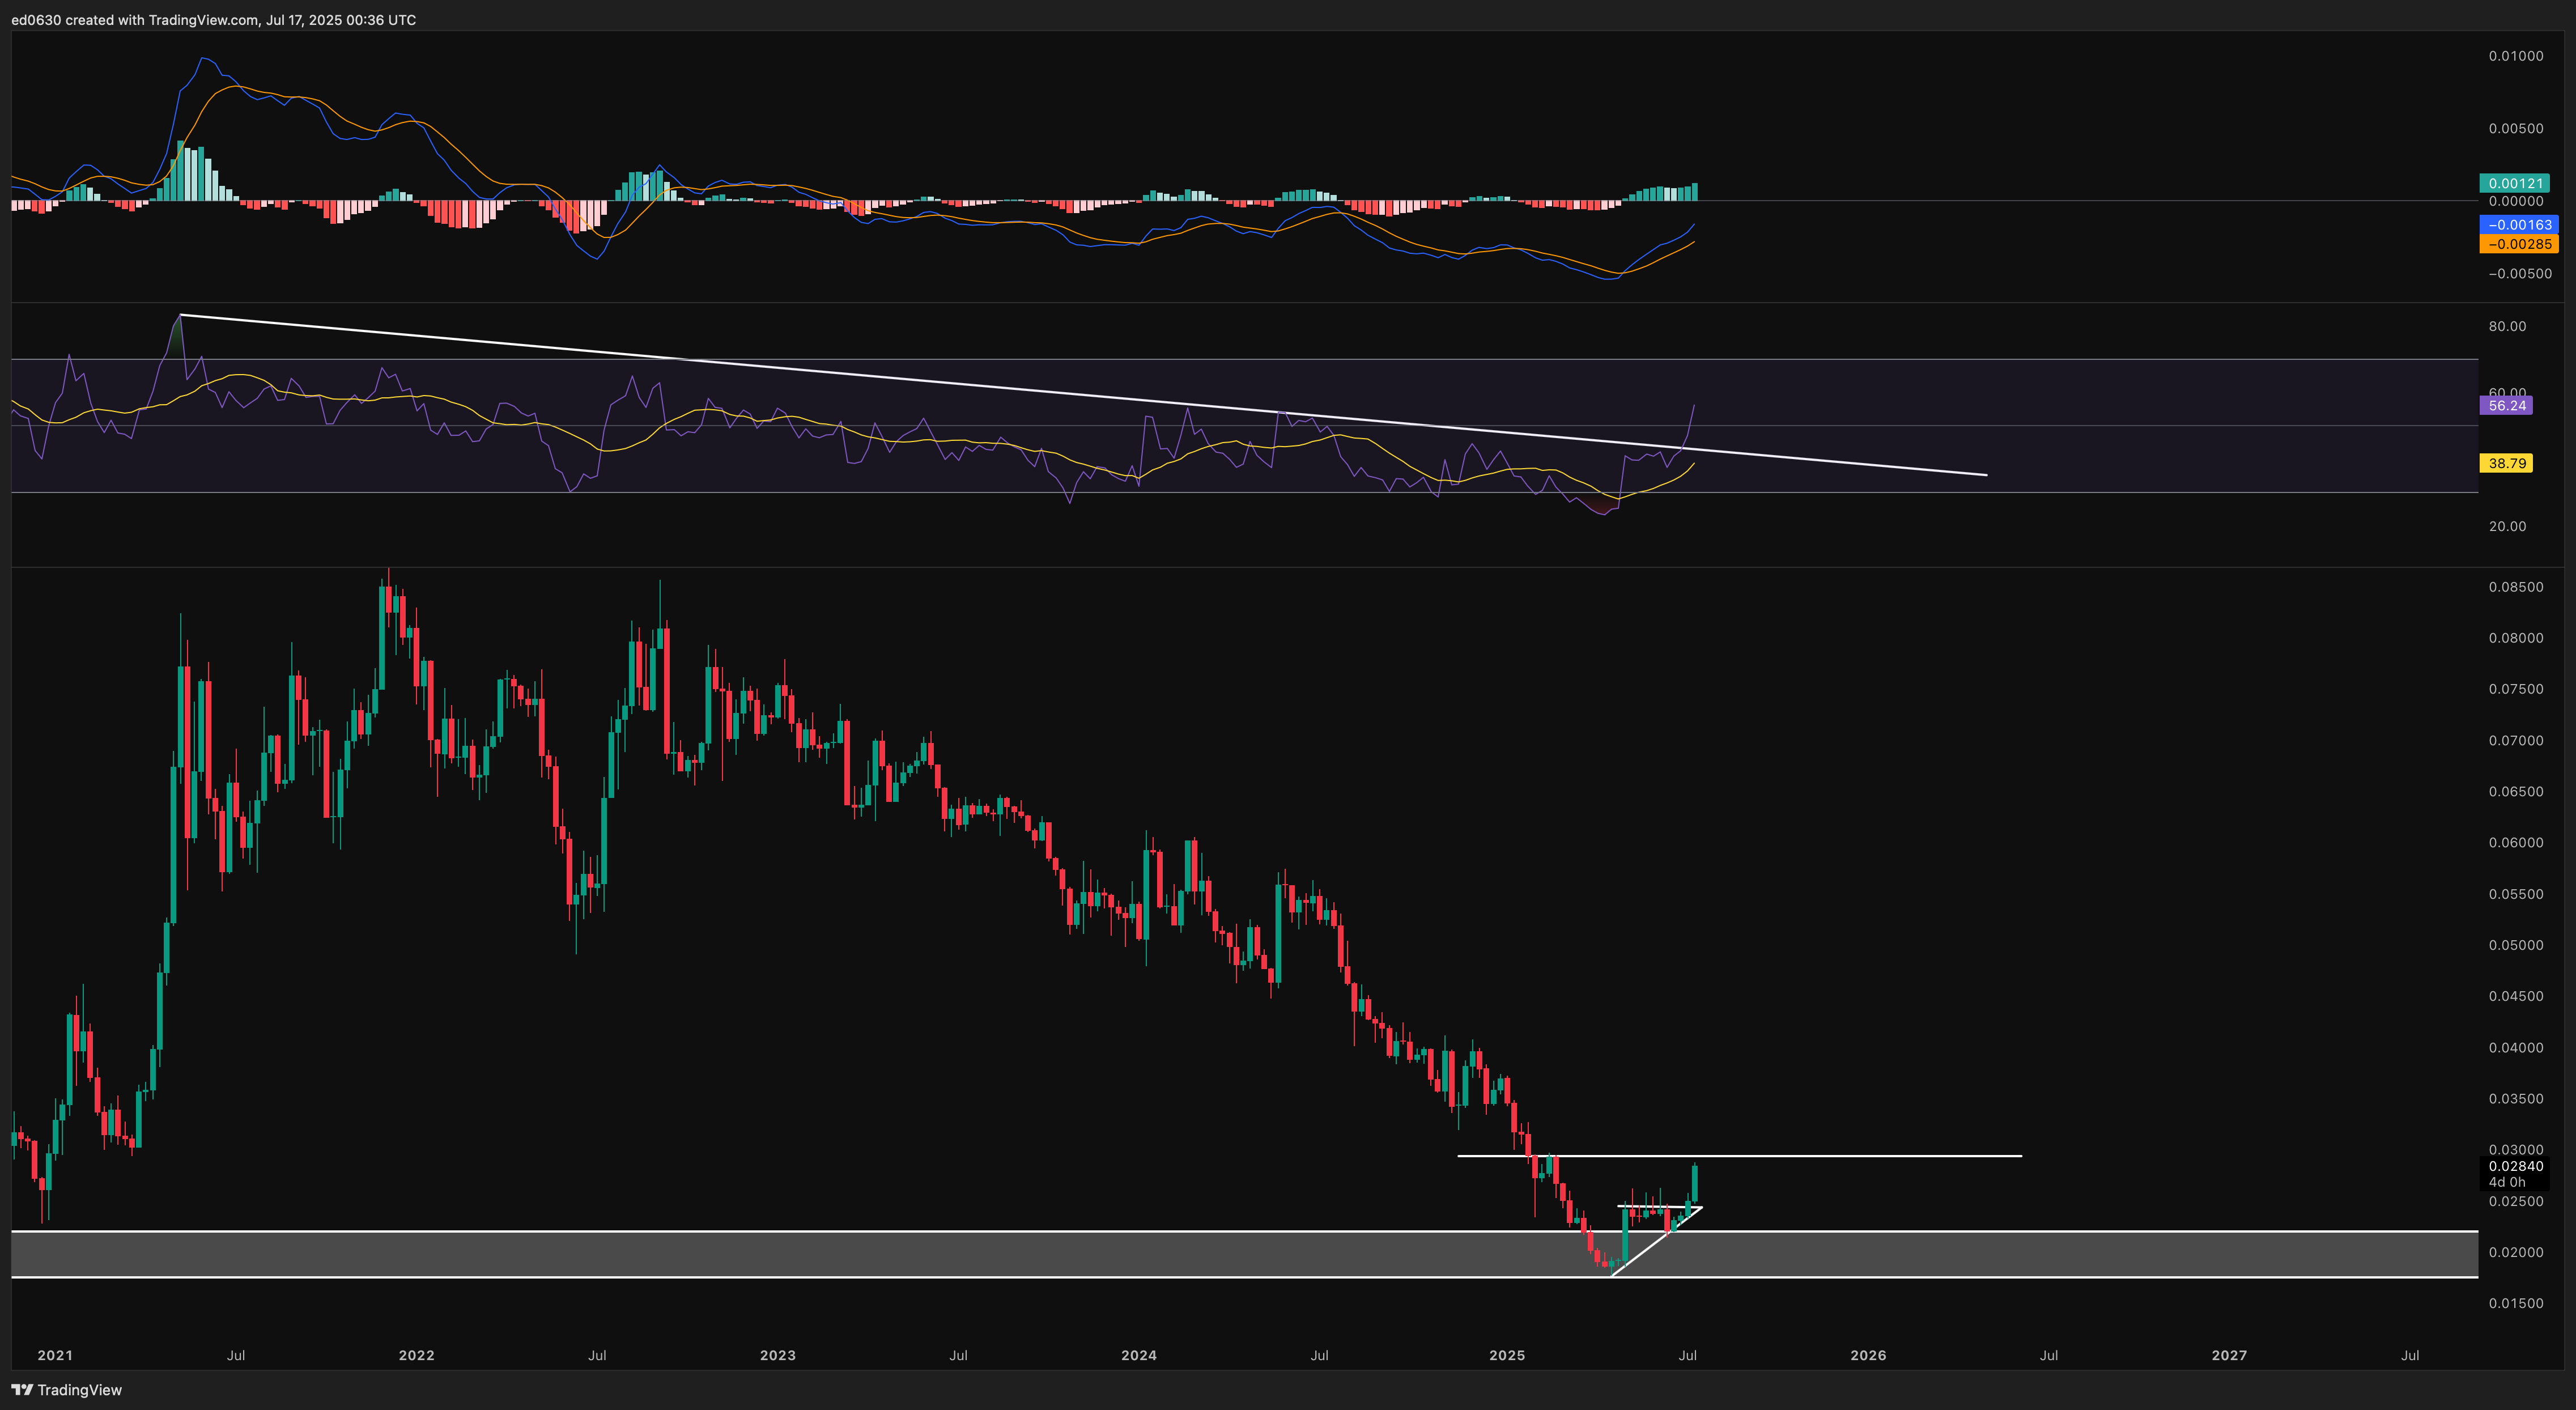
fibonacciiskingJun 30ETHBTC nailed it! we should be good for more up IMO. wait for confirmation above 0.0233