ETHUSD - Bullish Reversal Expected from Key Demand ZoneEthereum (ETH/USD) has reached a critical demand zone around $1,550 - $1,580, where strong buying interest has previously shown support. After a consistent downtrend, the price is now showing early signs of bullish reversal on the 2-hour chart.
If this level holds, a potential move towards the target area of $1,920 - $1,970 is likely. This area aligns with previous structure resistance and could act as a take-profit zone.
Key Highlights:
Entry Zone: $1,550 - $1,580
Target Zone: $1,920 - $1,970
Timeframe: 2H
Setup Type: Trend Reversal / Swing Trade
Risk Management: Always use a tight stop-loss below the demand zone
Idea: Wait for a bullish confirmation (like a strong bullish candle or pattern) before entering. This setup offers a favorable risk-to-reward ratio if the support holds.
ETHBULLUSD trade ideas

Something Brewing Disclaimer: Not financial advice! 🚨 Do your own research. Markets are risky—trade at your own discretion. I’m just sharing ideas, not guarantees. 📉📈

ETH-USD I will go high to higher After big dip I will go big up ..track till next week either SL or TP with huge reward..

ETHEREUM (ETHUSD): Strong Bullish Move Ahead?!
It looks like we have a valid liquidity grab after a test
of a key weekly structure on Ethereum.
After a false violation of the underlined area,
the price formed a cup and handle pattern
and violated its neckline with a bullish imbalance on an hourly chart.
I think that the market can remain bullish and reach at least 1700 level.
❤️Please, support my work with like, thank you!❤️

ETH Outlook after the Dip. What to expect NOW?Finally, the price broke the wedge, and the price experienced a significant drop. I think now is the time for ETH to rise again to 1900 . STRONG SUPPORT 1400 .
Give me some energy !!
✨We spend hours finding potential opportunities and writing useful ideas, we would be happy if you support us.
Best regards CobraVanguard.💚
_ _ _ _ __ _ _ _ _ _ _ _ _ _ _ _ _ _ _ _ _ _ _ _ _ _ _ _ _ _ _ _
✅Thank you, and for more ideas, hit ❤️Like❤️ and 🌟Follow🌟!
⚠️Things can change...
The markets are always changing and even with all these signals, the market changes tend to be strong and fast!!

FXAN & Heikin Ashi Trade IdeaBINANCE:ETHUSD
In this video, I’ll be sharing my analysis of ETHUSD, using FXAN's proprietary algo indicators with my unique Heikin Ashi strategy. I’ll walk you through the reasoning behind my trade setup and highlight key areas where I’m anticipating potential opportunities.
I’m always happy to receive any feedback.
Like, share and comment! ❤️
Thank you for watching my videos! 🙏

ETHUSDThello, guys. I hope you are doing great. This is my final call for ETH on daily charts; we have the inverted head and shoulder

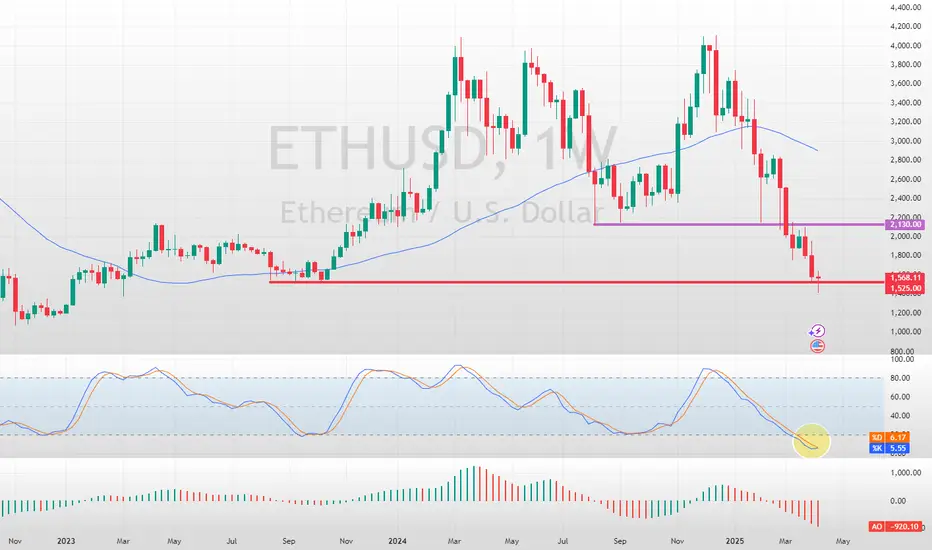
Ethereum Tests Critical Support LevelFenzoFx—Ethereum tests the critical support level at $1,525. A consolidation wave toward $2,130 could be imminent.
ETH short the pumpIf ETH pumps enough there is a short OP at $1780, tight stop at $1844, take profit $1527

Bearish ETH/USD Trade SignalEntry
Sell ETH/USD at $1,570
Stop Loss
$1,805 (above key resistance to manage risk)
Take Profit
$1,090 (targeting extended downside move)
Analysis
Ethereum has faced strong selling pressure over the past few weeks, and the downtrend is likely to continue for the next four weeks. Several factors contribute to this bearish outlook:
ZKasino Scammer Liquidation: The ZKasino exploit wallet lost $27 million after a leveraged ETH position was liquidated, highlighting panic selling in the market.
Market-Wide Sell-Off: ETH recently dropped to a two-year low of $1,480 amid record-breaking equity market losses.
Macroeconomic Pressure: Trump’s tariff policies triggered a sharp sell-off in global markets, leading to a broader crypto market correction.
Whale Liquidation Risks: A whale holding a $340 million ETH short position is at risk of liquidation if ETH drops below $1,119, suggesting further downside pressure.
Risk Management
The risk-to-reward ratio is favorable, targeting nearly 3:1 reward vs. risk.
Breakdown below $1,480 could accelerate ETH's decline toward $1,090, making this setup a high-probability trade.

Dont get your hype up - Eth might still be bearishI believe that this might be a start of a bearish movement.
Weekly candle closing below the 1660 USD is an indication of a start of a down trend for Ethereum and the next important level would be around the 1100 - 890 USD.
I recommend waiting on the monthly candle closure to confirm the above statement. It is always possible that this is a fake break out and Eth can recover from here (again on a monthly observation).
Let us wait for now


Ethereum will be in the bears' control in the mid-term (1D)Based on the recent pivot formations, momentum, and wave degrees, we are observing signs of a deeper correction on the Ethereum chart, which we find necessary to warn about.
As you know, we follow technical evidence and signals to provide analysis—we do not predict the market but rather analyze it step by step.
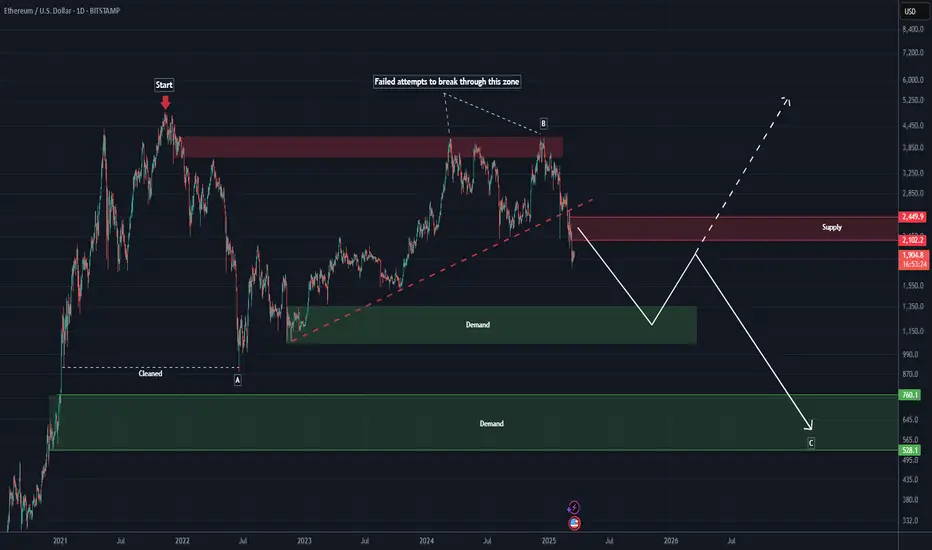
From the point where we placed the red arrow on the chart, Ethereum's price-time correction has begun.
It appears that an ABC pattern is forming, with wave B now completed or nearing completion after losing the trendline (red dashed line).
Wave C should align with the previous waves in degree and have a longer duration than wave A.
Since wave B retraced close to the top of wave A, wave C’s price correction may not fall too far below the low of wave A.
We have two possible scenarios: either Demand 1 will be the market bottom, or Demand 2.
A daily candle closing above the invalidation level would invalidate this analysis. Let's see how it plays out.
invalidation level : 2941$
For risk management, please don't forget stop loss and capital management
When we reach the first target, save some profit and then change the stop to entry
Comment if you have any questions
Thank You
ETH could head back up to 2000Even if it remains in this longstanding bearish channel ETH can retest resistance up around 2000. Tumbling down out of this channel would of course be uber-bearish. However even in this (overhyped?) Bloody Monday it managed to respect support. So a swing trade up this week is of interest to me.
Not advice. What are your thoughts?

ETHUSD is offering you an opportunity to buy it cheap!!Seriously guys, what are you waiting for. DCA the move, open a futures trade. Using x50, risk $50 and you will be glad you did.
Let me post so you see this trade on time and enter on time
Follow me as my trades are mostly market orders

ETH CHART: I FOUND THE BOTTOM!HERE IS MY FUNDA REASON OR NEWS WHY I THINK THIS IS THE LAST DROP~! BEFORE WE RECOVER AND START THE BUILDING OF CRYPTO!
Price Decline and Market Sentiment: Ethereum's price has dropped below $1,800, marking a significant decline of over 45% since the start of the year. This has raised concerns about its market stability, with some analysts predicting further drops to $1,550 if key resistance levels aren't reclaimed.
Investor Sentiment and FUD: Fear, uncertainty, and doubt (FUD) have led to increased selling pressure. Retail traders have been offloading ETH holdings, resulting in reduced trading volumes and network activity. Active addresses and transaction volumes have also declined, signaling lower demand!
Technical Challenges and Resistance Levels: Ethereum has struggled to break past critical resistance levels, such as $1,900. Its failure to reclaim these levels has validated bearish patterns, with some analysts warning of a potential drop to 17-month lows!
Macroeconomic Factors: Broader economic uncertainties, including geopolitical events like tariffs, have contributed to Ethereum's struggles. These factors have added to the negative sentiment in both the financial and crypto markets.
Network Activity and Whale Behavior: While some large investors (whales) are accumulating ETH, the overall network activity has seen a decline. This mixed behavior has created uncertainty about the asset's short-term trajectory

[Update ETH]: $1350-->$7000-->$800?I think we may go to retest the 0.75 level by the end of May, then blow off top very fast in Q4 to high 6000/low 7000. Then I think we gonna go slowly down <1000 until the end of this decade.
Mini bear market-> Fed will panic-pivot end of Q2 -> Final Blowoff top Q3/Q4-> Mega Recession

ETH MOMENTUM RANGE DCA BUY DIP 1350 - 1150ETH MOMENTUM RANGE DCA BUY DIP 1350 - 1150
📊 ETH MOMENTUM RANGE – DCA BUY THE DIP STRATEGY
This strategy applies a mid-term momentum approach with DCA (Dollar Cost Averaging) entries as ETH pulls back into a key support range.
🔹 Momentum Bias: Mid-term bullish as long as ETH holds above the 1350 level. Corrections within structure are considered healthy.
🔹 DCA Buy Range:
Buy Level #1: 1350 USDT
Buy Level #2: 1250 USDT
Buy Level #3: 1150 USDT
(Scaling into positions gradually as ETH dips into support zones)
🔹 Additional Confirmation Tools:
RSI oversold on H4 or Daily
Bullish divergence signals
Reversal volume spikes
🎯 Mid-Term Targets:
TP1: 1600
TP2: 1750
TP3 (Extension): 2000+ (if momentum continues with BTC support)
🛡️ Risk Management:
Flexible stop-loss below 1100 (cut if bullish structure is invalidated)
DCA capital allocation: evenly split or 40%-30%-30% per level

Aren't you glad you were PATIENT!! Opportunities incoming!I know I got on the nerve of some Crypto bulls over the past few months, stating over and over again that now was not the time to buy! Feel free to watch those linked below - they are absurdly accurate to what has happened since...
Well, I now present to you, Crypto Discount.
Stay patient and smart - but we're definitely approaching levels that could be excellent to start building a long term position in some of these names.
Happy Trading :)

Sell Now, Think Later'Sell Now, Think Later' stampede sends bitcoin, ether tumbling alongside Asian stocks
Hold GT to claim free airdrops and get a boost!

waiting for external market shiftsBack at the market bottom two years ago, we knew there were catalysts like ETF approvals, Bitcoin’s halving, and the Hong Kong market developments on the horizon. The market also believed in narratives like Layer 2 solutions, DePIN, and staking. At that time, "diamond hands" led the charge in accumulating assets like SOL CRYPTOCAP:SOL , BNB CRYPTOCAP:BNB , and SUI at the bottom.
Now, aside from waiting for external market shifts, there seems to be little else we can do. The much-discussed Ethereum staking ETF and SOL ETF within the crypto space are still at least months away, with the most optimistic timelines pointing to the summer and second half of the year. #SolanaETF #Pectra #ETFsOnFire
Hold NASDAQ:GT to claim free airdrops and get a boost!

Let’s put TradingView pattern detection on a test!This double top pattern is detected by the automated pattern detection provided by TradingView for paid subscribers.
If it is correct, gate of hell is about to open in crypto market!
If it is not happen, the integrity of the code will become questionable.
What do you think?

KEEP TRADING SIMPLE - ETH Good Afternoon,
Hope all is well. We are trading in a downtrend so please be careful, these need to be quick and calculated moves before determining if there is a reversal.
Volume is building, so is the support, this is a good spot to focus on a short term trade.
I have bought at this support level which is forming and will exit at resistance unless I see the trend hold and continue.
Have a great night.
ETH
