#Ethereum + $10k Local top!#Ethereum + $10k Local top!
A real #Altcoins Season will only begin when CRYPTOCAP:ETH rises.
Whether you love it or hate it, it's just a fact and the truth is always bitter.
ETHBULLUSD trade ideas
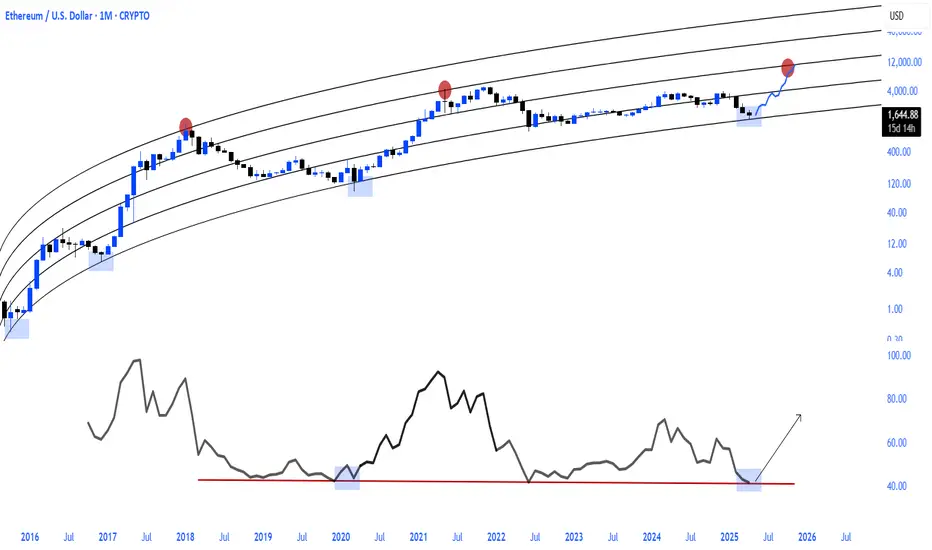
Eth Bullish Divergence Before the Last big rise to 4k we saw a Hidden bullish divergence.Now at this Moment we have a bullish divergence which could lead to a big jump in price.I am bullish above 1750k on the monthly Close.
Targets : 4k-7500k
Good Luck

Ethereum Hits Support – Time to Load Up?🎢 The Great 112‑Day Drop
What happened? Over the past 112 days, ETH tumbled –66%, sliding from $4109 down to $1383 and oh yeah, it even poked its nose below the January 2018 all-time high. 7 years ago!
Support Zone: 0.786 + Volume Profile
0.786 Fib: $1,570.85 (drawn from the 2022 low $870.80 to that $4109 high).
5‑Year POC: $1565
Hold Tight: For 2 weeks, the 0.786 level has acted as support, bouncing price right back up.
Sell in May and go away? Rather buy in May and grab some gains on the way?
Trade Blueprint: Your Ethereum Game Plan
Entry Zone: $1570.85
Stop Loss: Below $1369.79
Profit Targets: $1800, $2000 ,$2500, $3000
Risk/Reward: Risk ≈13%, Reward ≈91%, a solid 7:1 R:R
DCA
Missed the perfect entry? No drama... dollar‑cost average between $1700 and $1500.
Keep an eye on the monthly open at $1822. Bulls need to break this resistance zone.
Bottom Line
Ethereum’s –66% dive has handed us a golden ticket at the 0.786 fib and 5‑year POC. This is one of those “buy the dip” moments.
________________________________
💬 Found this helpful? Drop a like and comment below. Want TA on another coin? Let me know and I’ll break it down for you.
Happy trading everyone! 💪

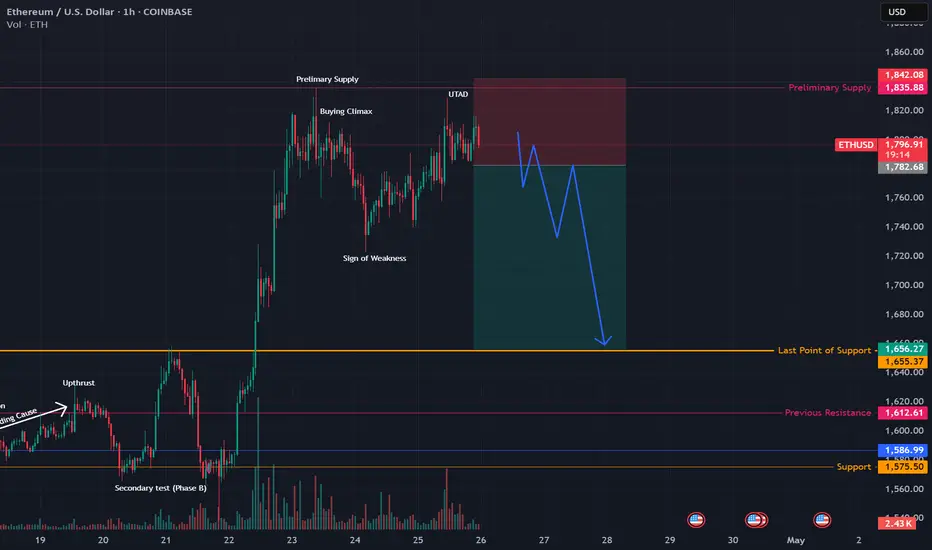
ETH Showing Weakness in Wyckoff DistributionLooks like we may see a nice pull back this weekend. Price has failed to break the labeled Buying Climax and is showing signs of a reversal. Retracement could be back to the last point of support around $1655. Here it can accumulate and continue its up move. I have posted a Idea targeting $2700, I still think this could be in play
ETHUSD Will Go Up From Support! Long!
Take a look at our analysis for ETHUSD.
Time Frame: 8h
Current Trend: Bullish
Sentiment: Oversold (based on 7-period RSI)
Forecast: Bullish
The market is testing a major horizontal structure 1,754.52.
Taking into consideration the structure & trend analysis, I believe that the market will reach 1,966.56 level soon.
P.S
Overbought describes a period of time where there has been a significant and consistent upward move in price over a period of time without much pullback.
Disclosure: I am part of Trade Nation's Influencer program and receive a monthly fee for using their TradingView charts in my analysis.
Like and subscribe and comment my ideas if you enjoy them!

Bearish drop?Ethereum (ETH/USD) is reacting off the pivot and could drop to the 50% Fibonacci support.
Pivot: 1,833.07
1st Support: 1,686.37
1st Resistance: 1,949.39
Risk Warning:
Trading Forex and CFDs carries a high level of risk to your capital and you should only trade with money you can afford to lose. Trading Forex and CFDs may not be suitable for all investors, so please ensure that you fully understand the risks involved and seek independent advice if necessary.
Disclaimer:
The above opinions given constitute general market commentary, and do not constitute the opinion or advice of IC Markets or any form of personal or investment advice.
Any opinions, news, research, analyses, prices, other information, or links to third-party sites contained on this website are provided on an "as-is" basis, are intended only to be informative, is not an advice nor a recommendation, nor research, or a record of our trading prices, or an offer of, or solicitation for a transaction in any financial instrument and thus should not be treated as such. The information provided does not involve any specific investment objectives, financial situation and needs of any specific person who may receive it. Please be aware, that past performance is not a reliable indicator of future performance and/or results. Past Performance or Forward-looking scenarios based upon the reasonable beliefs of the third-party provider are not a guarantee of future performance. Actual results may differ materially from those anticipated in forward-looking or past performance statements. IC Markets makes no representation or warranty and assumes no liability as to the accuracy or completeness of the information provided, nor any loss arising from any investment based on a recommendation, forecast or any information supplied by any third-party.

ETH/USDI think Ethereum is in wave 4. Wave C of the triangle has completed. I do not expect a new price ceiling for Ethereum for the Altcoin Season. For wave D, I expect growth to the $3,600 range.

[ETH] New Investment OpportunityThis is for me a new investment opportunity on CRYPTOCAP:ETH for the next bullrun. We see this crypto struggling a lot to pump and I am honestly not the biggest CRYPTOCAP:ETH fan as I am huge CRYPTOCAP:SOL fan but here is still an opportunity for me.
Great Trade !

ETH/USD🖼️ Macro Chart Overview (Weekly Timeframe):
Ethereum (ETH/USD) recently completed a significant technical structure on the weekly timeframe: a Rising Wedge, a pattern commonly associated with trend reversals from bullish to bearish conditions.
This chart captures the full life cycle of Ethereum's rally from the 2022–2024 lows, the topping pattern across late 2024, and the recent sharp breakdown confirming a shift in market sentiment.
🧩 Detailed Pattern Breakdown:
🔹 Formation of the Rising Wedge:
Higher Highs + Higher Lows: During the rally, price action consistently printed higher highs and higher lows, but within a narrowing price range.
Volume Behavior: As typical with wedges, trading volume declined during the wedge formation — a subtle sign of weakening bullish conviction.
Resistance Confluence: Price repeatedly failed near the $4,000 psychological zone, suggesting heavy distribution.
🔹 Breakdown Confirmation:
The rising wedge broke to the downside with a high-volume weekly bearish candle.
Subsequent price action showed no strong bullish recovery attempts, confirming that bulls had lost control.
📊 Key Technical Levels:
🔵 Resistance Zones:
$3,800 - $4,100: Major multi-week resistance; multiple failed breakouts.
$2,767 (SL Level): Secondary structure where breakdown retests may occur. A clean break above this would invalidate the bearish thesis.
🟢 Support Zones:
$1,500 - $1,600: Minor historical support (currently being tested during pullback).
$1,000 - $1,050: Major historical support from the 2020-2021 cycle, and the final target area.
⚡ Stop Loss and Target:
Stop Loss (SL): $2,767 — strategic location above last swing highs and resistance.
Take Profit (TP): Partial TP before $1,200 minor support; final TP around $1,007 major zone.
📉 Bearish Trading Strategy:
🪝 Trade Entry:
Wait for the current bullish pullback to complete.
Look for reversal candlestick patterns (bearish engulfing, shooting star, etc.) on Daily or 4H timeframes near local resistances.
Short entries ideally after rejection near minor resistance levels.
🛡️ Trade Management:
Secure partial profits at intermediate zones if sharp moves occur.
Trail stop to break-even once initial targets are hit.
Full exit at the $1,007 target or if bullish reversal structures start forming on high timeframes.
🔮 Price Behavior Expectations:
Short-term: Possible minor rally as price retests broken structure.
Mid-term: Bearish continuation to test lower support zones.
Long-term: A confirmed close below $1,000 could open doors for even deeper corrections (potential re-test of sub-$800 zones if macro conditions worsen).
🌐 Broader Market Context:
Macro Economic Factors (Fed policies, rate changes, global liquidity) are currently unfavorable for high-risk assets like cryptocurrencies.
Bitcoin correlation remains high — any breakdown in BTC will likely accelerate ETH’s downside.
Ethereum Fundamentals (network upgrades, ETH burn rate) could cushion some downside but are unlikely to counteract broad market trends alone.
🧠 Final Thoughts:
Ethereum is currently displaying one of the clearest bearish technical setups seen in recent months. The breakdown of a major rising wedge on a weekly chart suggests a potential major market correction rather than a minor retracement.
While short-term bounces are normal, the structure remains heavily bearish unless the price reclaims and holds above key resistance levels ($2,767 and higher). Traders should focus on trend following, risk management, and scaling into positions cautiously.
Patience will be key, as high-timeframe setups like these can take several weeks to fully play out.
🚀 Summary Checklist:
✅ Rising Wedge Breakdown Confirmed
✅ Resistance Strong at $4,000
✅ Bearish Pullback Setup in Progress
✅ Targeting $1,007 Support
✅ SL placed safely above key resistance
✅ Trade with risk management and patience


Ethereum: Falling Wedge, Double Bottom and MACD Divergence AlignA powerful bullish setup may be forming on ETH — but confirmation is everything. Watch how the falling wedge, double bottom, and MACD divergence align for one of the cleanest potential long opportunities.
Ethereum is now shaping a potentially powerful reversal structure, combining a falling wedge, a possible double bottom, and bullish MACD divergence. The price has been moving inside a well-defined downward channel since the December highs, gradually compressing within this wedge — and from my experience in both trading and teaching, Ethereum loves falling wedges. This pattern has historically worked well for ETH in previous cycles.
But it’s not enough to simply break out of the wedge. For the double bottom to fully confirm, price must also hold above the key ~$2,100 zone. Only then will all three factors — the wedge breakout, the double bottom confirmation, and the MACD bullish divergence — work together, aligning like a perfect constellation. I often say to my students: these moments are the trader’s “planetary alignment” — the rare setup where technicals support each other instead of contradicting.
If ETH manages to clear and retest this zone successfully, the structure opens the way toward the next targets at $2,350, $2,555, and potentially $2,800, as marked on the chart. These levels reflect previous accumulation zones and key reaction areas.
Another important factor is the correlation across markets. Bitcoin is also forming a double bottom, and we’re seeing a similar structure on the S&P 500. This potential synchronized movement between crypto and equities makes the setup even more interesting. Such alignment across assets doesn’t happen often — and when it does, it’s worth paying attention.
The key now is not to jump the gun. A clean breakout without confirmation often leads to fake moves. What I’m watching closely is whether ETH can close and hold above $2,100. Only then this setup becomes truly valid, offering an attractive entry point with a well-defined risk.
In my opinion, this is one of the most constructive technical scenarios we’ve seen on Ethereum in the past months. If the market confirms — the long opportunity here may come close to textbook perfection.

ETHUSDT We are in the C wave of a flat pattern, and with the completion of wave C, we expect the start of an upward wave.

ETH turned bullish on the daily chart, great R:R hereTargeting mid to upper 3000s in the mid-term (2-3 months) and expecting 5k plus by year end. ETH will get it's turn, don't worry

ETHEREUM BULLISH SIGNALMAKE SURE YOU MANAGE A PROPER RISK REWARD RATIO THIS IS A GOOD ENTRY FOR LONG WITH ETH. PRETTY BULLISH
As of April 25, 2025, Ethereum (ETH) is trading at approximately $1,811.85, reflecting a 2.3% increase from the previous close. The intraday high reached $1,820.32, while the low was $1,744.49.
Looking ahead, Ethereum is poised for significant growth, with projections suggesting potential price levels ranging from $5,000 to $14,000 by the end of 2025. These optimistic forecasts are underpinned by several key factors:
Institutional Adoption: The approval of Ethereum ETFs is expected to attract substantial institutional investment, enhancing liquidity and market confidence.
Bitsz
Technological Upgrades: Upcoming enhancements, such as the PECTRA upgrade, aim to improve scalability and efficiency, making Ethereum more attractive for decentralized applications and enterprise solutions.
The Currency analytics
+1
Bitsz
+1
Regulatory Clarity: Anticipated regulatory developments, including clearer guidelines on staking and potential favorable policies, could bolster investor confidence and adoption.
MarketWatch
While the current price is below its all-time high, Ethereum's foundational role in decentralized finance (DeFi), smart contracts, and NFTs positions it for substantial appreciation in the coming months.
In summary, Ethereum's bullish outlook is supported by strong institutional interest, ongoing technological advancements, and a favorable regulatory environment, suggesting a promising trajectory toward new all-time highs in 2025.


ETH big ass bull penantLFG
Few clean patterns
Angled cup and handle
Penant on last leg
Not financial advice

ETHEREUM | 1H | IMPORTANT LEVELS AND MY TARGETHey there, my dear friends!
I’ve taken a deep dive into BINANCE:ETHUSDT just for you. If it breaks above the 1,693 level, the next target will be 1,800.0. On the flip side, a key support level sits around 1,473.0.
All I ask in return is your support through likes — it really means a lot!
Big thanks to everyone showing love and support with those likes!

ETH Will Flip Bitcoin – Sooner Than You ThinkEveryone’s watching ETFs and halvings — but here’s what they’re not seeing:
Ethereum isn’t just a currency.
It’s digital infrastructure — powering AI, tokenized real estate, RWAs, and decentralized identity.
The next wave of global finance will run on Ethereum.
📈 My prediction:
By Q1 2026, ETH will flip BTC in market cap.
Not hype — mathematics + macro + mass adoption.
🧠 Smart money is already rotating.
Are you paying attention?
⏳ Don't say "nobody warned you."

ETH - weekly plan Marked the important levels in this video for this week and considered a few scenarios of price performance
Important support level for this week is $1,700
Write a comment with your coins & hit the like button and I will make an analysis for you
The author's opinion may differ from yours,
Consider your risks.
Wish you successful trades! MURA

Ethereum (ETH) – Strategic Trade PlanEthereum (ETH) continues to show resilience, currently trading around $1,790 after a strong bounce earlier this month. While the crypto market remains volatile, ETH is holding key technical levels that could fuel a major move in the coming weeks.
🎯 Entry Points:
Market Price: $1,790 — Ideal for an early position, as ETH holds above critical support zones.
$1,645 — Secondary strong support, aligning with the 20-day EMA; great for scaling in if market pulls back.
$1,400 — Deep value zone, offering a high-risk/high-reward setup if broader market correction occurs.
💰 Profit Targets:
$2,500 — First major resistance. A realistic mid-term target if bullish momentum sustains.
$3,000 — Psychological milestone and breakout confirmation level.
$3,800+ — Ambitious but achievable with broader crypto market recovery and strong ETH network metrics.
🛡️ Risk Management:
Set stop-losses dynamically below each entry support level.
Scale into positions progressively to manage volatility.
Monitor macroeconomic trends and Bitcoin's influence closely.
🔍 Key Observations:
Strong on-chain activity supports a bullish thesis.
Current resistance around $1,812 must be broken to confirm bullish continuation.
Be cautious of sudden market-wide corrections — always plan your exits and manage your risk accordingly.
📢 Disclaimer: This is not financial advice. Trading cryptocurrencies involves significant risk, and you should only invest what you can afford to lose. Always perform your own research before entering any position.

Wajani Investments: ETHUSD AnalysisPair is currently at demand zone acting as a strong support become resistance zone as shown. Price has also made it first LH at current price. In addition, a wedge is formed which is usually a reversal pattern as shown. All these factors point to the fact that this pair is done shorting and the bulls are ready to take the market up.
Let me know your thoughts.
Thank you.

ETHEREUM is about to make a TOPEthereum, the second-largest cryptocurrency by market cap, stands at a critical juncture, grappling with competitive pressures, scaling challenges, and shifting market sentiment.
BEARS ARE LOSING CONTROL
ETH is an obvious play for me right now.
