ETHBULLUSD trade ideas

Textbook price action on ETHToday's CRYPTOCAP:ETH price action looks like something straight out of a textbook on technical analysis, where resistance becomes support. Depending on how adventurous you're feeling, you could:
1. Go long now : Set a stop-loss around 2050 (better to choose a non-round number, e.g., 2053) and take profit before the upper support at 4110—say, around 3950. This would yield a reward-to-risk ratio of about 3.5, depending on your entry point.
2. Wait for a pullback : If CRYPTOCAP:ETH drops to the support level around 2115 and holds, consider going long closer to that level, with the same stop-loss as above, and set take profit before the middle support around 2765. Depending on your entry, this strategy can offer a similar reward-to-risk ratio.
3. Test the middle support : If CRYPTOCAP:ETH reaches the middle support at about 2815, observe its behavior. Should that mini-resistance convert into support, go long with a stop-loss at 2705 and take profit at 3950. This setup can provide a great reward-to-risk ratio, depending on where you enter.
4. Consider a short : If the resistance around 2815 holds, you might short CRYPTOCAP:ETH and set take profit a bit before 2115. However, shorting crypto is quite adventurous for my taste—it's better to do so through options to avoid accidentally blowing up your account.

Ethereum (ETH/USD) at a Crossroads: Technical and Macro AnalysisEthereum (ETH) is currently trading at a critical support zone around $2,800 - $2,850, facing key technical levels that could determine its next major move. However, beyond technicals, a significant macroeconomic event—the new U.S. tariffs on Canada, Mexico, and China—could introduce further volatility into the market.
These tariffs, announced by the Trump administration, include a 25% levy on Canadian and Mexican imports and a 10% tariff on Chinese goods. With potential ripple effects on global trade, inflation, and Federal Reserve policy, traders must factor in both technical and macro elements to navigate the Ethereum market effectively.
Ethereum’s Technical Landscape
Long-Term Structure (2W & 1W Charts)
• Ethereum is forming a falling wedge, a traditionally bullish reversal pattern if it breaks to the upside.
• The $2,800 - $2,850 region is a major support zone, with a key resistance area at $3,175 - $3,200.
• Breakout targets could extend to $3,600+, while a breakdown risks testing $2,500 - $2,600.
Medium-Term Outlook (3D & 1D Charts)
• ETH has tested the lower boundary of its descending wedge multiple times, showing strong buying interest.
• Volume has been increasing near support, indicating possible accumulation.
• The RSI (Relative Strength Index) is forming a bullish divergence—while price is making lower lows, RSI is making higher lows, a potential sign of reversal.
Short-Term (4H & 1H Charts)
• Ethereum recently rejected from $3,175, showing continued downward pressure.
• The Stochastic RSI is deeply oversold, suggesting a bounce is possible.
• The Bookmap heatmap shows strong buy liquidity around $2,800, reinforcing support at this level.
Macroeconomic Factors: U.S. Tariffs and Federal Reserve Policy
1. The New U.S. Tariffs
The Trump administration has announced new tariffs on Canada, Mexico, and China, including:
• 25% tariff on Canadian and Mexican imports.
• 10% tariff on Chinese goods.
• Canadian energy exports face a reduced tariff of 10%.
These tariffs are set to take effect on February 4, 2025 and could disrupt global trade, potentially leading to increased production costs in the U.S. economy.
2. Will Inflation Rise?
Historically, tariffs increase costs for businesses, potentially fueling inflationary pressure. However, it’s important to note that:
• During Trump’s first term (2017-2021), similar tariffs did not lead to major inflation.
• Inflation remained relatively stable until COVID-19 supply chain shocks and Federal Reserve monetary expansion in 2020-2021.
However, in the current environment, the impact could be different. With higher baseline inflation and ongoing Federal Reserve concerns, new tariffs may create additional inflationary stress.
3. Federal Reserve Response: Interest Rates & Market Liquidity
• If tariffs cause inflation to rise, the Federal Reserve may delay interest rate cuts—which could strengthen the U.S. dollar (DXY) and pressure risk assets like Ethereum.
• A stronger dollar historically leads to lower ETH prices, as crypto trades inversely to DXY.
• If the Fed maintains high interest rates longer than expected, liquidity in crypto markets may remain tight, limiting ETH upside.
Confluence of Technical and Macro Factors: What’s Next for ETH?
Given both technical and macroeconomic insights, here’s what traders should watch:
Bullish Scenario
✅ $2,800 support holds, leading to a breakout from the falling wedge.
✅ If ETH breaks above $3,175, next resistance at $3,600 comes into play.
✅ A weaker DXY (U.S. dollar) and Fed rate cuts could fuel a major rally.
Bearish Scenario
❌ A break below $2,800 could send ETH down to $2,500 - $2,600.
❌ If tariffs increase inflation and delay Fed rate cuts, ETH could face macroeconomic headwinds.
❌ If the dollar strengthens, ETH may see downward pressure.
Final Thoughts
Ethereum is currently at a major inflection point, both technically and fundamentally. While the falling wedge pattern suggests a potential breakout, macroeconomic factors—including new U.S. tariffs and Federal Reserve rate decisions—could significantly impact price action.
For traders, the $2,800 support zone is critical—holding above this level could fuel a rally, while breaking below it could signal further downside.
Key Levels to Watch:
✅ Support: $2,800 → $2,600 → $2,500.
✅ Resistance: $3,175 → $3,600 → $4,000.
Given the confluence of technical and macroeconomic factors, Ethereum remains a highly volatile asset. Traders should monitor economic data, Federal Reserve statements, and global liquidity trends to stay ahead of the next major move.
📊 What’s your ETH outlook? Share your thoughts below! 🚀

Key support level to holdEth needs to hold this level otherwise 2400 will be next. US markets Free fall tomorrow and things could get dicey. Best to wait to see how support holds and other markets open to determine how best to proceed.

ETHUSD DID ITI doubted ETHUSD will go below 2900 to complete the 3 drive pattern as regards my previous post. I know it is likely but I didnt want it to and now it did.
All doubts regarding the bullish move is now cleared.
If you're still expecting one last purge, you will miss the whole move.
I'm really happy right now.
My followers will make huge chuck of cash this bull season. LFG
TP still remains the same

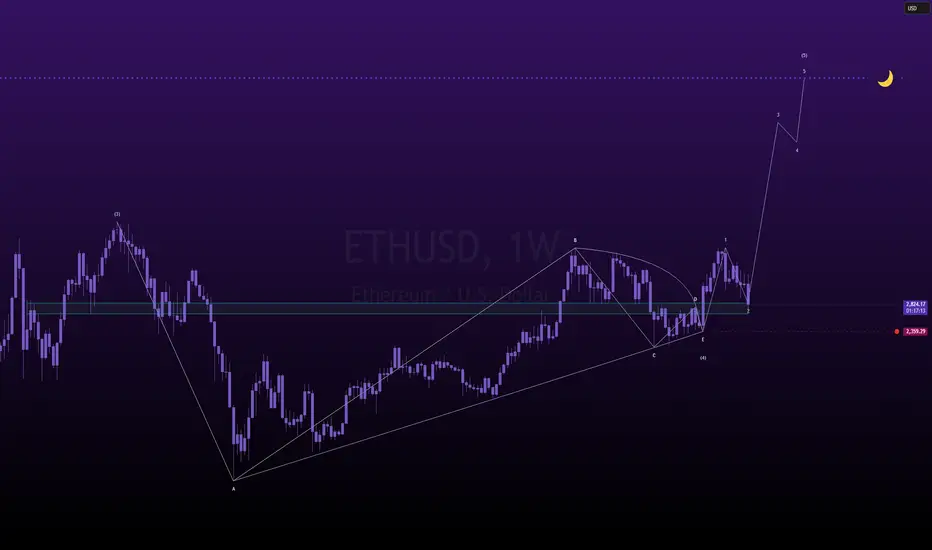
a l t s e a s o n b e g i n sread that title one more time anon,
and then again.
bookmark this post,
come back to it in a few months and tell me you made money,
or come back to it, and tell me how wrong i was.
either way,
this is the primary.
---
there is blood on the streets, so i come here on this eve' to share my perspective, to shed a little light on how i'm looking at this structure. i don't have to put this update out today, i really don't, but i'm doing it for you, the people. if i'm wrong, so be it, but if i'm right, donate a portion of your winnings to a charity and go live out the rest of your life away with a smile on your face.
---
my theory on ethereum is simple,
i'm labeling the entire move from november 2021 -> november of 2024 as a triangle.
for this triangle to work out, it is imperative for ethereum to stay above 2359.29 which is the hard invalidation on my idea.
sweep this low, and ethereum can see a liquidation down to $800, where the real trench will be discovered.
---
keep in mind, i am not a financial advisor, this is simply my best bullish take on a market which so many are fleeing from, during a time where alt season is on the verge of beginning.
🌙
ETH | Alternative Chart Pattern | EducationJust a short update for my latest C&H post
Price is also forming an Ascending Triangle pattern with a liquidity zone of $2,800 - $3,000 for an average spot for buyer to step in
When trading chart patterns it's best to figure out how to jump in before the breakout similarly to the last touches highlighted in blue on the bottom trendline
You can see that price was forming a bottom-like pattern or what I also like to call price accumulation and then vice versa for the tops.

EHTUSD is Still Running ShortETHUSD broker the regression channel about two weeks ago and failed to move into a long bias since then.
Support is now getting close - let's see how price action develops.

REVERSE HS FORMATION ETHThis one might be an easy win! I believe ETH will rise a lot before end of this bull market 2025! This can be a reverse HS formation!


Election Rally Price BalanceThis is simple, Trumps Election win caused a massive rally with no retrace back to November 6th. We have to balance out that price action before we break the ceiling of $4,000. I also believe we had a massive gain on Crypto New Comers and this is the way they will get wiped out. Call it a Bear Trap, Shakeout, Liquidator. We will eventually climb back up.

$ETH fills the Golden PocketMy limit orders (spot) filled, waiting for my limit orders to get filled for long leverage positions. Details in my post from last night :)

ETHUSD/ LongThis is a personal project of mine that will consist of 10 trades in a row, specifically for this instrument, based mainly on 5 and 15min. time frames. There will be no fixed TP or SL, but I will watch for a certain formation of candles + 2 indicators.
When closing the short position, it will be noted in the idea.
The usual duration of 1 trade could be between 1 - 5 days.
3d trade / 11.48 UTC / 01.02 / 3243.5

ETH Secondary trend. Channel. Potential triangle. 25 12 24Logarithm. Time frame 3 days.
With altcoins (overflow of profits from bitcoin, now) along with XRP this is asset #1 for pumping, the reason for this is liquidity, which is extremely necessary for large capital. The average price of 1 distribution zone is conditionally 10 thousand. These are not the maximums of the cycle.
When the price lingers in this zone and there is a massive positive news background, all L2 assets, which are now in their accumulation zones, or in retests of breakout zones, will "fly" to super pumps (this is what it is). In percentage terms, they will show an order of magnitude greater profit in their distribution zones. Remember, as a rule, such assets (low liquidity) are first pumped by an aggressive pump (to leave in parts, without regret) by a huge %, and only then is a distribution zone formed on a rollback (channel, triangle ...) (hope for a huge profit on the continuation of the pump).
This idea is a continuation of this idea (which I can't update) of a secondary trend, the goals of which have been achieved with utmost precision:
ETH/USD Secondary trend. Bullish triangle. Breakout. Target 96% 11 11 2023
It is worth noting that now in the news background: "ether is bad" , huge fake short positions for the news background. Many crypto media personalities speak negatively about the “prospects” of this very promising cryptocurrency of the “American” (Jewish) transnational financial conglomerate JPMorgan Chase (size of depository assets — $ 32.4 trillion, size of assets under administration — $ 7.7 trillion, etc.). What kind of lack of prospects can we talk about??
If they “stink” a lot to create public opinion, then there is probably an interested party in this. That is, it is worth doing everything the opposite of what they want to inspire, and as a result, tilt supply/demand in a favorable direction, which, as a rule, is always unprofitable for most market participants.
If you are an investor , then buy at any price (you can use martingale in parts, or place trigger orders for a breakthrough of important zones), and do not be interested in the opinion of the majority (meaningless market noise) and the news background (manipulation, deception). Sell in the distribution zone (time is known in advance when, 2 zones) with a huge profit, as for a liquid trading instrument.
If you are a small investor or trader , then pay attention to the L2 group of assets and ETC (big pump “stick”), and use ETH itself as an indicator of “when”.
Also, the idea shows an unlikely scenario, or rather two scenarios. Consider this in your risk management.
The idea of the main trend , published several years ago. Which, of course, is still relevant now. Everything develops organically, and extremely precisely according to plan.
ETH/USD Main trend Pump/dump cycles. Accumulation/Distribution 8 09 2022
Trend in general for clarity now.
locally this potential triangle (it doesn't exist yet) looks like this.


Ethereum (eth) Long entry setup supply and demand + ote 📊 Precise Setup for a Long Entry on ETH/USD
💡 Why this trade?
🔹 Strong demand zone detected (S&D)
🔹 Optimal Trade Entry (OTE) confirmed by the 62%-79% Fibonacci retracement
🔹 Bullish breakout + strong reaction at a key order block
🎯 ETH/USD Trade Plan
✅ Optimal entry point (OTE) 📍: Waiting for a fresh bullish demand zone on H1 or M15
✅ Key demand zone (S&D) 🛑: $3,060.00
🔥 ETH is setting up for a strong move! This Supply & Demand + OTE strategy offers a high-probability trade with an excellent risk-to-reward ratio.
📢 Follow for more exclusive analysis and trade signals! 🚀
#Ethereum #Crypto #Trading #ETH #SupplyAndDemand #OTE #SmartMoney #DayTrading #SwingTrading #CryptoSignals #TechnicalAnalysis

ETHUSD IS AT DAILY SUPPORT LEVEL Technically:
ETHUSD is at support level
ETHUSD printing hidden divergence
I think it respect the support zone

ETHUSD TARGET ARCHIVED 3050ETHUSD TARGET Complete 3050$ not financial advice trade and manage your own risk.

Eth same structure as last falling wedge.We're currently trading at nr.8.
Very bullish structure ! matter of days here before we go up.
This is also an inverse head & shoulders pattern with a target of 6K.


ETHUSD BUY ANALYSIS FALLING WEDGE PATTERN Here on Ethusd price form a falling wedge pattern and now try to go up so as the line 3341.2 has broken trader should go for long with expect profit target of 3810.4 and 4243.2 . Use money management

$ETH VOLATILITY AHEAD!Needless to say, CRYPTOCAP:ETH has to hold this anchored trend line since election day. Doesnt look great with fake breakout --> and dropping from the volume shelf
volatility ahead!
