Tons of bearish signals on ETH WeeklyI happened to see someone ask "when will ETH run?" So I just wanted to take a stab at the chart. I have never played this, but I noticed cycles. During it's IPO you can clearly see a head & shoulder. After the next bull cycle, a larger head and shoulder pattern. Currently we appear to be on the downside of a triple top; we are below the neck line. If price rallies to the neckline, I will watch for rejection to head lower toward range bottoms. If it breaks recent lows and retests, further downside. Let me see how I can get in on some action.
Any ETH chartists with insight?
ETHBULLUSD trade ideas

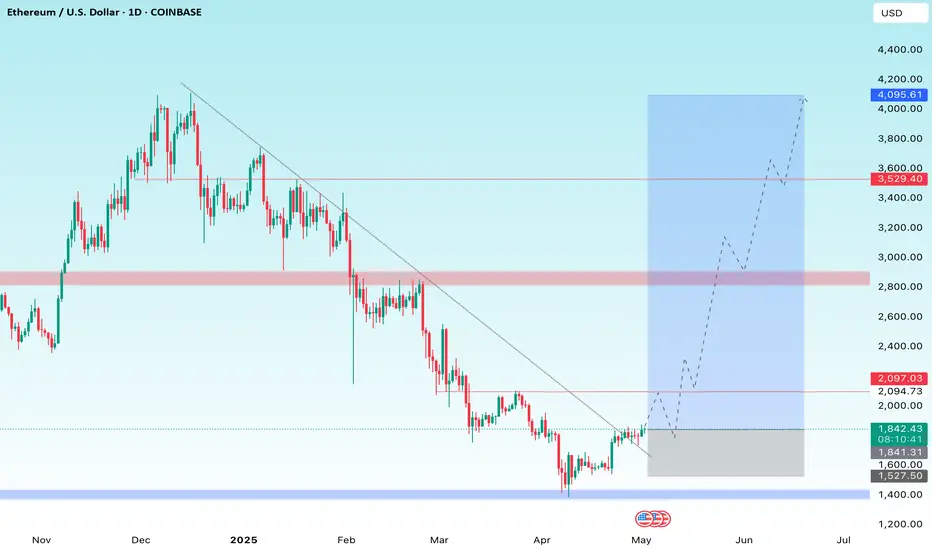
Ethereum (ETH) Breaks Descending Trendline – Eyeing $4,000?Ethereum (ETH) Breaks Descending Trendline – Eyeing $4,000?
Description:
Ethereum has officially broken out of a long-term descending trendline on the daily timeframe, signaling a potential trend reversal. After holding support near the $1,500–$1,600 zone, ETH has started forming higher lows and is now aiming for key resistance zones. A bullish scenario could see price rally toward $2,800, with a possible extension toward the $3,500–$4,000 zone if momentum continues.
The breakout is supported by strong price structure and rejection from major demand zones, making this a chart worth watching closely. Will the bulls take control and drive ETH back to 2024 highs?
Technical Levels to Watch:
• Support: $1,840 / $1,600
• Resistance: $2,100 / $2,800 / $3,530 / $4,095
Follow for more updates as this setup develops. Let’s see how Ethereum reacts to this breakout!
Stay tuned for live updates & detailed trade setups. Drop your thoughts below and don’t forget to follow for more high-probability analyses!
ETHUSD – Breaker Block Rejection in Play?Ethereum has been consolidating in a rising channel after failing to break below the 1754 support zone for weeks. Yesterday, price tapped into the 1854 resistance — which also aligns with a bearish breaker block — but failed to close above, showing two strong rejections so far.
Current Observation:
The 1854 level is holding up as resistance, and the most recent candles show weakness at that zone. If price fails to break and close above it, we could see a move back down toward the 1687–1694 support area.
What I'm Watching:
– A confirmed close below the breaker block zone around 1854 could trigger a short setup, with 1754 as the first target.
– If 1754 breaks, I’ll be eyeing the next zone between 1686.8 and 1694.1 for a potential take-profit zone or reaction.
Key Levels:
– Resistance: 1854 → 1881
– Support: 1754 → 1694 → 1687
If 1854 continues to reject price, I’ll be looking to go short on confirmation, targeting a drop back into the lower support zones.
But if we get a strong close above 1854, I’ll reassess for possible upside continuation.
Let’s see how it reacts.
Trade safe.
pClem Trades

Ether-Bitcoin Ratio Signals ETH Is 'Extremely Undervalued,' The cryptocurrency market is a realm of intricate signals, complex metrics, and often-conflicting narratives. Among the myriad indicators traders and investors scrutinize, the Ether-Bitcoin (ETH/BTC) ratio holds a prominent place. This metric, a simple division of Ethereum’s price by Bitcoin’s price, serves as a barometer for the relative strength and market sentiment between the two leading crypto assets. Recently, this ratio has dipped to levels that historically signaled significant undervaluation for Ether, sparking debate about a potential upcoming rally. However, a confluence of factors – notably surging ETH supply, stagnant network demand, and a weakened token burn mechanism – casts a considerable shadow over this optimistic outlook, suggesting that past performance may not be a reliable guide in the current, uniquely challenging environment.
Understanding the ETH/BTC Ratio: A Barometer of Relative Strength
At its core, the ETH/BTC ratio reflects the market's perception of Ethereum's value proposition relative to Bitcoin. When the ratio trends upwards, it indicates that ETH is outperforming BTC, suggesting growing investor confidence in Ethereum's ecosystem, technological advancements, or utility. Conversely, a declining ratio signifies BTC's relative strength, potentially due to factors like "digital gold" narratives, safe-haven appeal, or specific Bitcoin-centric catalysts.
A low ETH/BTC ratio, such as those observed in recent times, is often interpreted by analysts as a sign that ETH is "cheap" or "undervalued" compared to Bitcoin. The logic is that, over time, capital flows within the crypto market tend to seek out assets with stronger growth potential or those perceived as lagging behind their fundamental value. If ETH is indeed undervalued, the expectation is that it will eventually catch up, leading to a rally in both its USD price and its value relative to BTC. This potential for "mean reversion" or a "catch-up trade" is what excites many market participants when the ratio hits historical lows.
Historical Precedents: When Undervaluation Sparked Rallies
The argument for an impending ETH rally based on the current low ETH/BTC ratio is not without historical merit. There have been several instances where a depressed ratio preceded substantial upward movements for Ether.
1. Post-2018 Crypto Winter: After the ICO boom and subsequent crash, the ETH/BTC ratio languished for an extended period. However, as the DeFi (Decentralized Finance) ecosystem began to gain traction in 2020 ("DeFi Summer"), ETH, as the foundational layer for most DeFi protocols, experienced a resurgence. The ratio climbed significantly as capital flowed into Ethereum to participate in yield farming, lending, and decentralized exchange activities.
2. The NFT Boom (2021): The explosion of Non-Fungible Tokens (NFTs) in early 2021, predominantly on the Ethereum blockchain, provided another major catalyst. The increased demand for ETH to mint, buy, and sell NFTs pushed its price and the ETH/BTC ratio upwards, as Ethereum's utility as a platform for digital collectibles and art became undeniable.
3. Anticipation of The Merge (2021-2022): As Ethereum moved closer to its pivotal transition from Proof-of-Work (PoW) to Proof-of-Stake (PoS) – "The Merge" – market sentiment turned increasingly bullish. The promise of significantly reduced energy consumption, coupled with the "ultrasound money" narrative (where ETH issuance would drastically decrease and potentially become deflationary due to EIP-1559's burn mechanism), fueled strong buying pressure. The ETH/BTC ratio saw notable gains during periods of heightened Merge anticipation.
In these instances, the low ETH/BTC ratio acted as a tinderbox, and specific fundamental catalysts served as the spark that ignited significant rallies. Investors who recognized the undervaluation signal and anticipated these catalysts were handsomely rewarded. This historical pattern underpins the current optimism among some analysts who see the present low ratio as a similar buying opportunity.
The Complicating Factors: Why This Time Might Be Different
Despite the compelling historical precedents, the current market environment for Ethereum presents a unique set of challenges that complicate the simple "undervalued, therefore rally" thesis. These headwinds stem from fundamental shifts in Ethereum's tokenomics and network dynamics.
1. Surging Supply: The Post-Merge Issuance Reality
While The Merge successfully transitioned Ethereum to a more environmentally friendly PoS consensus mechanism, its impact on ETH supply has been more nuanced than initially portrayed by some bullish narratives.
• Staking Rewards: Under PoS, new ETH is issued as rewards to validators who stake their ETH to secure the network. While the rate of new ETH issuance is significantly lower than it was under PoW, it is still a consistent inflationary pressure. The annual inflation rate from staking rewards is currently in the low single digits.
• Net Issuance vs. Deflation: The "ultrasound money" thesis largely depended on the EIP-1559 burn mechanism (discussed later) consistently burning more ETH than is issued through staking rewards, leading to a net deflationary supply. However, this has not always been the case post-Merge. There have been extended periods where ETH has been net inflationary.
• Unstaking and Liquid Staking Derivatives: The ability for validators to unstake their ETH (enabled by the Shanghai/Capella upgrade) means that previously locked supply can re-enter the market. Furthermore, the proliferation of Liquid Staking Derivatives (LSDs) like Lido's stETH or Rocket Pool's rETH, while enhancing capital efficiency, also means that staked ETH is not entirely removed from liquid circulation, as these derivative tokens can be traded or used in DeFi.
This consistent, albeit reduced, issuance contributes to sell pressure, especially if demand does not keep pace. The narrative of ETH becoming a deflationary asset has been weakened, impacting one of the key bullish arguments that previously supported a higher ETH/BTC ratio.
2. Flat Demand: A Stagnant Network Picture
For ETH's price to appreciate significantly, there needs to be robust demand for the token, driven by network usage and adoption. Currently, several indicators suggest that demand is, at best, flat, and in some areas, declining.
• Network Activity Metrics: Key on-chain metrics such as daily active addresses, transaction counts, and total gas consumed have shown periods of stagnation or even decline. While Layer 2 scaling solutions are processing more transactions, this activity doesn't always translate directly into proportional demand for ETH on the mainnet, especially if Layer 2s manage their own fee markets efficiently.
• Total Value Locked (TVL) in DeFi: While DeFi remains a cornerstone of Ethereum's value proposition, the growth in TVL has slowed considerably compared to the explosive growth seen in 2020-2021. Capital inflows into DeFi protocols on Ethereum have been less aggressive, partly due to macroeconomic conditions, regulatory concerns, and the emergence of competitive DeFi ecosystems on other blockchains.
• Competition from Alternative Layer 1s and Layer 2s: Ethereum faces increasing competition from other Layer 1 blockchains (e.g., Solana, Avalanche, Aptos, Sui) that offer higher throughput and lower transaction fees, attracting users and developers. Moreover, Ethereum's own Layer 2 ecosystem (e.g., Arbitrum, Optimism, Polygon zkEVM, Starknet, zkSync Era), while crucial for its long-term scalability, also fragments user activity and can, in some ways, reduce direct demand pressure on ETH for L1 transactions if users primarily operate within these L2 environments.
• Macroeconomic Headwinds & Regulatory Uncertainty: Broader economic conditions, including inflation, interest rate hikes, and recession fears, have generally dampened risk appetite across financial markets, including crypto. Additionally, the ongoing regulatory uncertainty in key jurisdictions like the United States creates an environment of caution, potentially hindering institutional adoption and large-scale investment in assets like ETH.
• NFT Market Cool-Down: The NFT market, which was a significant driver of ETH demand, has experienced a substantial cool-down from its peak in 2021-2022. While innovation continues, transaction volumes and average sale prices have fallen, reducing the ETH velocity associated with this sector.
Without a significant uptick in genuine network demand – more users transacting, more capital flowing into DeFi, a resurgence in NFT activity, or new killer dApps emerging – it becomes harder for ETH to absorb the ongoing supply issuance and stage a sustainable rally.
3. Weakened Burn Mechanics: The Diminished Impact of EIP-1559
EIP-1559, implemented in August 2021, was a landmark upgrade for Ethereum. It introduced a mechanism where a portion of every transaction fee (the "base fee") is burned, permanently removing that ETH from circulation. This was a key pillar of the "ultrasound money" narrative, as it created a deflationary pressure that could, under conditions of high network demand, outpace new ETH issuance.
However, the effectiveness of this burn mechanism is directly tied to network congestion and the level of the base fee.
• Lower Network Congestion: In periods of lower network activity and congestion (as has been observed more frequently recently), the base fee required to get transactions included in a block decreases. A lower base fee means less ETH is burned per transaction.
• Impact of Layer 2s: As more transaction activity shifts to Layer 2 scaling solutions, which have their own, typically much lower, fee structures, the demand for block space on Ethereum Layer 1 can decrease. While L2s do periodically batch transactions and settle them on L1 (consuming L1 gas and contributing to the burn), the overall L1 gas consumption directly attributable to individual user transactions might be lower than if all those transactions occurred on L1.
• Periods of Low Burn: Consequently, there have been extended periods post-Merge where the amount of ETH burned via EIP-1559 has been insufficient to offset the ETH issued as staking rewards. During these times, ETH's supply becomes net inflationary, undermining the deflationary narrative that was a strong catalyst in previous cycles.
While EIP-1559 remains a crucial and beneficial upgrade for Ethereum's fee market predictability, its power as a consistent deflationary force has been tempered by the current realities of network demand and the evolving Layer 2 landscape.
Synthesizing the Outlook: A Tug-of-War
The current situation for Ethereum is a complex tug-of-war. On one side, the historically low ETH/BTC ratio flashes a compelling "undervaluation" signal, suggesting a potential for significant upside based on past market behavior. This attracts traders looking for relative value plays and those who believe in Ethereum's long-term fundamental strengths.
On the other side, the fundamental picture is clouded by persistent, albeit reduced, supply issuance, a lack of explosive growth in network demand, and a burn mechanism whose deflationary impact is currently muted. These factors create genuine headwinds that could prevent ETH from easily replicating its past ratio-driven rallies.
For ETH to truly capitalize on its apparent undervaluation relative to Bitcoin, several things likely need to occur:
1. A Resurgence in Demand: This could come from a new "killer app" or narrative on Ethereum, a significant rebound in DeFi or NFT activity, increased institutional adoption (perhaps spurred by clearer regulation or new investment products like spot ETH ETFs in more jurisdictions), or a general improvement in macroeconomic conditions that boosts risk appetite.
2. Successful Maturation and Value Accrual from Layer 2s: As Layer 2 solutions mature and gain wider adoption, their success needs to translate into tangible value accrual for ETH itself. This could happen through increased L1 settlement demand, the use of ETH as a primary gas token on L2s, or innovative mechanisms that tie L2 economic activity back to the L1 token. EIP-4844 ("Proto-Danksharding") is a step in this direction by aiming to reduce L2 transaction costs, potentially fostering more L2 activity and, consequently, more L1 settlement.
3. A Shift in Broader Market Sentiment: Often, major altcoin rallies, including for ETH, occur after Bitcoin has established a strong uptrend and market sentiment becomes broadly bullish. A sustained Bitcoin rally could create a "wealth effect" and encourage capital to rotate into ETH and other altcoins.
Conclusion: Caution Warranted Despite Undervaluation Signals
While the ETH/BTC ratio strongly suggests that Ether is trading at a significant discount compared to Bitcoin, historical precedent alone may not be enough to guarantee a rally in the current market. The fundamental challenges posed by ongoing supply, relatively flat demand, and a less potent burn mechanism are significant and cannot be ignored.
Investors and traders eyeing ETH must weigh the allure of its apparent undervaluation against these tangible headwinds. A potential ETH rally is likely contingent not just on the ratio mean-reverting, but on a demonstrable improvement in Ethereum's core demand drivers and a favorable shift in the broader market environment. The "extremely undervalued" signal is a call for attention, but thorough due diligence and a clear understanding of the current complexities are more crucial than ever. Ethereum's long-term vision remains ambitious, but its path to reclaiming relative market dominance against Bitcoin in the near term appears more challenging than in previous cycles.

Ethereum $ETH – Breakout from Accumulation Zone!
ETH has successfully reclaimed the accumulation zone after consolidating for weeks. This zone previously acted as a strong demand area and is now a potential launchpad for higher prices.
🔸 Upside Target: $3,500 - $4,500
The breakout above $2,000 signals a bullish shift. A confirmed move past $2,200 could trigger continuation towards $2,800, $3,500, and eventually the $4,500 psychological level.

ETH/USD LONG SETUPThe Ethereum chart displays a clear bullish breakout from a consolidation phase, driven by strong upward momentum. The price surged after holding above an ascending trendline, indicating buyer strength. However, as the move extends, it approaches a potential resistance zone where price exhaustion may occur. This presents a favourable setup for a short trade if reversal signs appear, such as bearish patterns or weakening volume. Traders should monitor closely for entry confirmation to capitalize on a pullback. The strategy focuses on a high-to-low retracement toward previous support, aligning with risk-managed short-selling principles.
Entry: 1,980
Target Point: 2,300

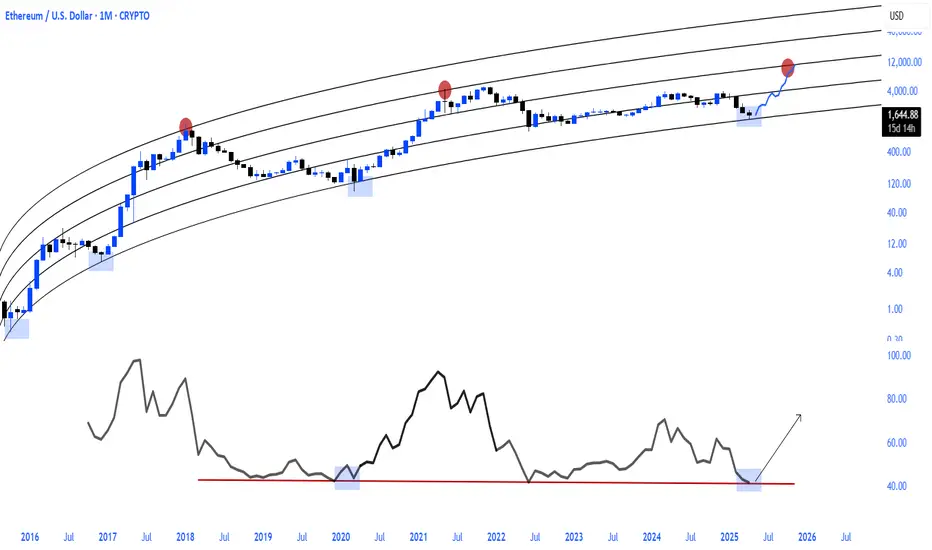
Where is ETH headed? What are the targets?Historically, it’s clearly visible that after a significant correction of 65–75%, ETH has always bounced back to the 0.382 level and slightly above. I don’t know if that will happen this time, but as soon as we approach the 0.382 level, I’ll consider closing my positions.

ETHUSD SHORT TERM BULLISH RETEST OF PREVIOUS SUPPORT/RESISTANCEAlthough the medium long term price target range for ETHUSD is the 900 price zone area, which is the previous lows on JUNE 2022, the short term consolidation price target remains the SEPTEMBER 2024 support at 2145,which should provide a strong platform for resistance for further advance in the short term. This should also coincide with BTCUSD retesting the previous All time highs @ 109k.

Ethereum Stock Chart Fibonacci Analysis 050725Trading Idea
1) Find a FIBO slingshot
2) Check FIBO 61.80% level
3) Entry Point > 33/61.80%
Chart time frame: D
A) 15 min(1W-3M)
B) 1 hr(3M-6M)
C) 4 hr(6M-1year)
D) 1 day(1-3years)
Stock progress: A
A) Keep rising over 61.80% resistance
B) 61.80% resistance
C) 61.80% support
D) Hit the bottom
E) Hit the top
Stocks rise as they rise from support and fall from resistance. Our goal is to find a low support point and enter. It can be referred to as buying at the pullback point. The pullback point can be found with a Fibonacci extension of 61.80%. This is a step to find entry level. 1) Find a triangle (Fibonacci Speed Fan Line) that connects the high (resistance) and low (support) points of the stock in progress, where it is continuously expressed as a Slingshot, 2) and create a Fibonacci extension level for the first rising wave from the start point of slingshot pattern.
When the current price goes over 61.80% level , that can be a good entry point, especially if the SMA 100 and 200 curves are gathered together at 61.80%, it is a very good entry point.
As a great help, tradingview provides these Fibonacci speed fan lines and extension levels with ease. So if you use the Fibonacci fan line, the extension level, and the SMA 100/200 curve well, you can find an entry point for the stock market. At least you have to enter at this low point to avoid trading failure, and if you are skilled at entering this low point, with fibonacci6180 technique, your reading skill to chart will be greatly improved.
If you want to do day trading, please set the time frame to 5 minutes or 15 minutes, and you will see many of the low point of rising stocks.
If want to prefer long term range trading, you can set the time frame to 1 hr or 1 day.

Will ETHUSD Break Out Today? Looks like ETH has wicked down the last few days in a row without a break of lower low's.
With the FOMC meeting today will ETH break out to the upside $2,500+?
Sure looks like there is a great chance. Will be interesting before 2:30PM EST FOMC meeting.


ETHUSD Stuck Below 1,830 – Bulls Losing Steam or Gearing Up?Ethereum remains range-bound below the 1,830 🔼 resistance after a failed bullish breakout attempt. Price has been consolidating between the 1,500 🔽 support and the 1,830 🔼 resistance for weeks. A breakout from either level will determine the next directional move.
Support at: 1,500 🔽
Resistance at: 1,830 🔼, 2,100 🔼, 2,530 🔼, 3,040 🔼, 4,036 🔼
Bias:
🔼 Bullish: Break and close above 1,830 could open room toward 2,100 and 2,530.
🔽 Bearish: Rejection at 1,830 or drop below 1,700 could push price back toward 1,500.
📛 Disclaimer: This is not financial advice. Trade at your own risk.


[ETH] New Investment OpportunityThis is for me a new investment opportunity on CRYPTOCAP:ETH for the next bullrun. We see this crypto struggling a lot to pump and I am honestly not the biggest CRYPTOCAP:ETH fan as I am huge CRYPTOCAP:SOL fan but here is still an opportunity for me.
Great Trade !

#Ethereum + $10k Local top!#Ethereum + $10k Local top!
A real #Altcoins Season will only begin when CRYPTOCAP:ETH rises.
Whether you love it or hate it, it's just a fact and the truth is always bitter.
ETHUSD: Strong Growth Ahead! Long!
My dear friends,
Today we will analyse ETHUSD together☺️
The market is at an inflection zone and price has now reached an area around 1.800.9 where previous reversals or breakouts have occurred.And a price reaction that we are seeing on multiple timeframes here could signal the next move up so we can enter on confirmation, and target the next key level of 1.828.4.Stop-loss is recommended beyond the inflection zone.
❤️Sending you lots of Love and Hugs❤️

This is just to show off my trendline skills, nothing more Hmmm. This is ethereum obviously. I don’t know much about TA but I think the little I learned put me a step ahead and I’m thankful for OpenAI. I get to work with a personal trainer or every information and logic I need.. just a chat away. It’s incredible.
So I think Eth is consolidating, just learnt that word. And it’s getting ready to do something. The logic is to just ride the wave of the market.. it’s almost impossible if you don’t know the trajectory of the market. But if you do then you one step safer…. Trendline helps with that

Bullish on ETHAlso quick #ETH analysis for you boyz.
Price did manage to cross this red trendline which was holding the price down and Its showing signs of forming a Higher Lows. Those two are early indicators of trend reversal.
Lets Keep an eye on 200 EMA

ETHUSD is forming a H&S pattern on the H1ETHUSD is forming a H&S pattern on the H1 chart. The right shoulder has yet to finish forming so our TP1 will be on the neckline. TP2 will be if it breaks out from the trendline and TP3 will be the completion of the H&S pattern. Pattern will be invalidated if it breaks past the shoulder line.
Please do not risk more than 1% per trade。
If you like the idea, please help like the post and comment down your thoughts below! I would love to hear your thoughts!

Ethereum (ETH) – Strategic Trade PlanEthereum (ETH) continues to show resilience, currently trading around $1,790 after a strong bounce earlier this month. While the crypto market remains volatile, ETH is holding key technical levels that could fuel a major move in the coming weeks.
🎯 Entry Points:
Market Price: $1,790 — Ideal for an early position, as ETH holds above critical support zones.
$1,645 — Secondary strong support, aligning with the 20-day EMA; great for scaling in if market pulls back.
$1,400 — Deep value zone, offering a high-risk/high-reward setup if broader market correction occurs.
💰 Profit Targets:
$2,500 — First major resistance. A realistic mid-term target if bullish momentum sustains.
$3,000 — Psychological milestone and breakout confirmation level.
$3,800+ — Ambitious but achievable with broader crypto market recovery and strong ETH network metrics.
🛡️ Risk Management:
Set stop-losses dynamically below each entry support level.
Scale into positions progressively to manage volatility.
Monitor macroeconomic trends and Bitcoin's influence closely.
🔍 Key Observations:
Strong on-chain activity supports a bullish thesis.
Current resistance around $1,812 must be broken to confirm bullish continuation.
Be cautious of sudden market-wide corrections — always plan your exits and manage your risk accordingly.
📢 Disclaimer: This is not financial advice. Trading cryptocurrencies involves significant risk, and you should only invest what you can afford to lose. Always perform your own research before entering any position.

ETH turned bullish on the daily chart, great R:R hereTargeting mid to upper 3000s in the mid-term (2-3 months) and expecting 5k plus by year end. ETH will get it's turn, don't worry

ETH/USDI think Ethereum can also be viewed from this perspective, as it has completed wave 4 of super wave 5. For wave 5 of super wave 5, it could reach a price of $6,700.

[WAITING] ETHUSDT - Binance | What now?Welcome,
- Status: Neutral
- ETH Stil Consolidation, waiting signal for validation entry
Keep wait..
Lets see..
