$1875: The Level to Watch for Ethereum's Next Big MoveETHUSD formed a double top around $1875 and showed a minor sell-off. It hits an intraday low of $1834 and is currently trading around $1837.
Overall trend remains bullish as long as support $1500 remains intact. The key near-term resistance is at $1875 (trend line joining $4109 and $3746) any breach above targets $2000/$2300/ $2500/$2770/$3000/$3400/$3600/$3800/$4000. A robust bullish trend will only materialize above $4100.
Immediate support is around $1675. Any violation below will drag the price down to $1620/$1500/$1200/$1000. A breach below $1000 could see Ethereum plummet to $800/$500.
It is good to buy above $1875 with SL around $1500 for a TP of $2770/$3000.
ETHBULLUSD trade ideas

ETH/USDI think Ethereum can also be viewed from this perspective, as it has completed wave 4 of super wave 5. For wave 5 of super wave 5, it could reach a price of $6,700.

[WAITING] ETHUSDT - Binance | What now?Welcome,
- Status: Neutral
- ETH Stil Consolidation, waiting signal for validation entry
Keep wait..
Lets see..

ETHUSD is forming a H&S pattern on the H1ETHUSD is forming a H&S pattern on the H1 chart. The right shoulder has yet to finish forming so our TP1 will be on the neckline. TP2 will be if it breaks out from the trendline and TP3 will be the completion of the H&S pattern. Pattern will be invalidated if it breaks past the shoulder line.
Please do not risk more than 1% per trade。
If you like the idea, please help like the post and comment down your thoughts below! I would love to hear your thoughts!

EthereumETHUSD
- Completed " 123 " Impulsive Waves
- Break of Structure
- Demand Zone
- Ascending Triangle in Short Time Frame
- Order Block

Bearish drop?Ethereum (ETH/USD) is reacting off the pivot and could drop to the 50% Fibonacci support.
Pivot: 1,833.07
1st Support: 1,686.37
1st Resistance: 1,949.39
Risk Warning:
Trading Forex and CFDs carries a high level of risk to your capital and you should only trade with money you can afford to lose. Trading Forex and CFDs may not be suitable for all investors, so please ensure that you fully understand the risks involved and seek independent advice if necessary.
Disclaimer:
The above opinions given constitute general market commentary, and do not constitute the opinion or advice of IC Markets or any form of personal or investment advice.
Any opinions, news, research, analyses, prices, other information, or links to third-party sites contained on this website are provided on an "as-is" basis, are intended only to be informative, is not an advice nor a recommendation, nor research, or a record of our trading prices, or an offer of, or solicitation for a transaction in any financial instrument and thus should not be treated as such. The information provided does not involve any specific investment objectives, financial situation and needs of any specific person who may receive it. Please be aware, that past performance is not a reliable indicator of future performance and/or results. Past Performance or Forward-looking scenarios based upon the reasonable beliefs of the third-party provider are not a guarantee of future performance. Actual results may differ materially from those anticipated in forward-looking or past performance statements. IC Markets makes no representation or warranty and assumes no liability as to the accuracy or completeness of the information provided, nor any loss arising from any investment based on a recommendation, forecast or any information supplied by any third-party.

$ETH - Ethereum enters buy zoneHey traders!
How is your portfolio doing? Trump is shaking us!
After all these months in 2025 I've tried to project a new scenario (bullish/bearish) that clarifies our next outlook.
Not an easy job. As you see day by day, markets are in high volatility due to trade war and (not trying to be pesimistic) could be worse.
However, In my opinion Ethereum (and altcoin markets) are entering into a golden opportunity. that has to be taken 100%. Don't know where is the bottom for CRYPTOCAP:ETH on a short scenario. But, what I can certainly say is that won't fall as a stone for too long.
Ranges between 1400 - 2000 USD are gold prices to make progressives buys. Although it could fall even more ( 900 - 1200 USD) I think this is a high Risk reward buy.
But, timing is not on time. Shouldn't I sell, expecting a bear market( you know Halving and Posthalving ideas). Times have changed as the macro scenario has not been the same as the previous bullruns.
So, it's time to accumulate and expect a possible expansion cycle in 2026.. That could lead Ethereum to prices never seen before. Yes, the range between 8.000 - 15.000 USD.
As I always say. Just my opinion. Stay safe!

Weekly-Analysis:Ethereum (ETH)–Issue 275 (Free access)The analyst believes that the price of ETHUSD will increase within the time specified on the countdown timer. This prediction is based on a quantitative analysis of the price trend.
___Please note that the specified take-profit level does not imply a prediction that the price will reach that point. In this framework of analysis and trading, unlike the stop-loss, which is mandatory, setting a take-profit level is optional. Whether the price reaches the take-profit level or not is of no significance, as the results are calculated based on the start and end times. The take-profit level merely indicates the potential maximum price fluctuation within that time frame.

ETH - weekly plan Marked the important levels in this video for this week and considered a few scenarios of price performance
Important support level for this week is $1,700
Write a comment with your coins & hit the like button and I will make an analysis for you
The author's opinion may differ from yours,
Consider your risks.
Wish you successful trades! MURA


Bearish drop off pullback resistance?Ethereum (ETH/USD) is reacting off the pivot and could drop to the 1st support.
Pivot: 1,808.27
1st Support: 1,451.43
1st Resistance: 2,102.09
Risk Warning:
Trading Forex and CFDs carries a high level of risk to your capital and you should only trade with money you can afford to lose. Trading Forex and CFDs may not be suitable for all investors, so please ensure that you fully understand the risks involved and seek independent advice if necessary.
Disclaimer:
The above opinions given constitute general market commentary, and do not constitute the opinion or advice of IC Markets or any form of personal or investment advice.
Any opinions, news, research, analyses, prices, other information, or links to third-party sites contained on this website are provided on an "as-is" basis, are intended only to be informative, is not an advice nor a recommendation, nor research, or a record of our trading prices, or an offer of, or solicitation for a transaction in any financial instrument and thus should not be treated as such. The information provided does not involve any specific investment objectives, financial situation and needs of any specific person who may receive it. Please be aware, that past performance is not a reliable indicator of future performance and/or results. Past Performance or Forward-looking scenarios based upon the reasonable beliefs of the third-party provider are not a guarantee of future performance. Actual results may differ materially from those anticipated in forward-looking or past performance statements. IC Markets makes no representation or warranty and assumes no liability as to the accuracy or completeness of the information provided, nor any loss arising from any investment based on a recommendation, forecast or any information supplied by any third-party.

ETHUSD-SELL strategy 6 hourly chart KAGIIt feels we are bit overextended. We have had a nice run up from $ 1,550 area and now we are on top side of the expected outcome short-term. The channel top is clearly observed and we have an overbought state, suggesting we should a move back towards $ 1,600 area.
Strategy SELL @ $ 1,790-$ 1,825 and take profit near $ 1,625 for now.

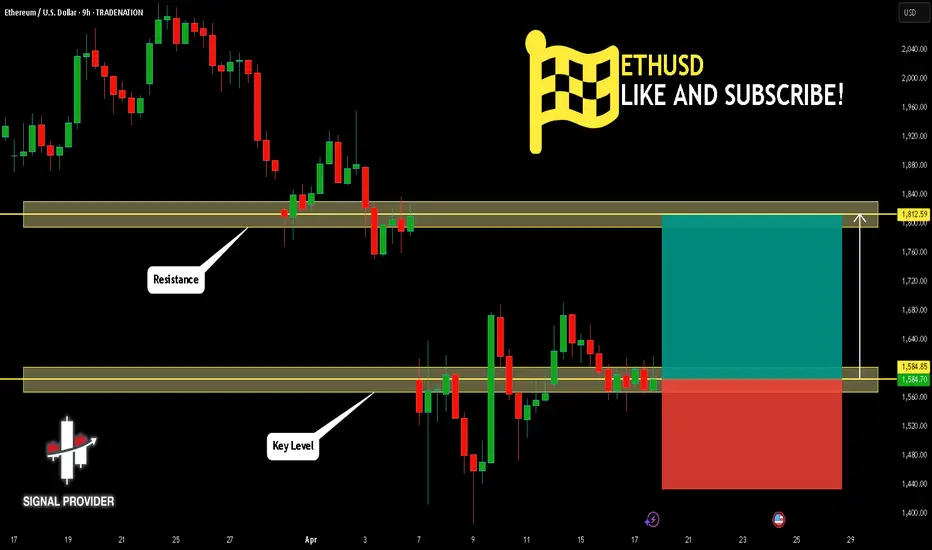
ETHUSD Will Go Higher! Buy!
Take a look at our analysis for ETHUSD.
Time Frame: 9h
Current Trend: Bullish
Sentiment: Oversold (based on 7-period RSI)
Forecast: Bullish
The market is testing a major horizontal structure 1,584.85.
Taking into consideration the structure & trend analysis, I believe that the market will reach 1,812.59 level soon.
P.S
The term oversold refers to a condition where an asset has traded lower in price and has the potential for a price bounce.
Overbought refers to market scenarios where the instrument is traded considerably higher than its fair value. Overvaluation is caused by market sentiments when there is positive news.
Disclosure: I am part of Trade Nation's Influencer program and receive a monthly fee for using their TradingView charts in my analysis.
Like and subscribe and comment my ideas if you enjoy them!
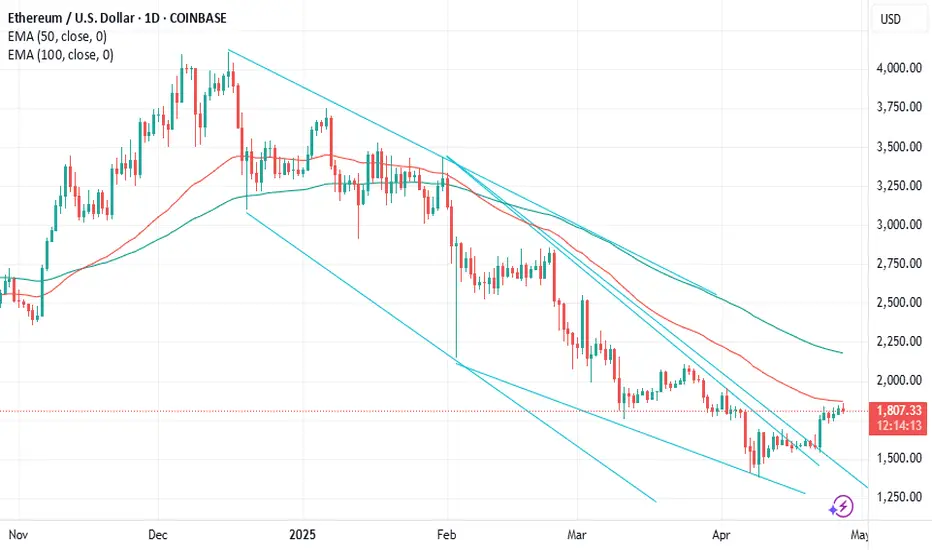
$ETH It's never to late to get on EMA 50 hitETH is on a climb, its still 50% cheaper than beginning of year.

Ethereum´s local and possibly even macro bottom is in!- first ever White Stripe present on the 3W which is a very high time-frame
- Eth has experienced a more than 60% drop ever since the highs with no real relief inbetween
- at the very least, a strong bounce to 2400, 2500 is expected
- there is also the possibility that this is THE bottom before eventually Eth makes new ATHs, possibly this but probably next year

ETH/USD Breakout Trading Setup – Long Entry with 16% Target PoteEntry Point: $1,593.08
Target Point: $1,807.83
Stop Loss: $1,472.68
Risk/Reward Ratio: Roughly 2.1:1
Indicators Used:
EMA 30 (Red Line) at $1,593.08 (near entry point)
EMA 200 (Blue Line) at $1,605.09
Analysis:
1. Consolidation Phase:
ETH is in a sideways range after a prior downtrend, consolidating within the purple support zone.
This zone (~$1,555 to ~$1,593) has been tested multiple times, suggesting a strong base.
2. Bullish Breakout Anticipation:
The setup expects a breakout above consolidation, targeting a 16.11% move to $1,807.83.
A breakout strategy is being applied, assuming ETH will reverse from this consolidation area a

[ETH] New Investment OpportunityThis is for me a new investment opportunity on CRYPTOCAP:ETH for the next bullrun. We see this crypto struggling a lot to pump and I am honestly not the biggest CRYPTOCAP:ETH fan as I am huge CRYPTOCAP:SOL fan but here is still an opportunity for me.
Great Trade !

ETHEREUM is about to make a TOPEthereum, the second-largest cryptocurrency by market cap, stands at a critical juncture, grappling with competitive pressures, scaling challenges, and shifting market sentiment.
BEARS ARE LOSING CONTROL
ETH is an obvious play for me right now.

ETH bullish Super bullish as BTC leads as market indicator. A great place to take a risk after recovering 10% from lows.
Entry to TP1 is looking good.

Nobody appreciate it !!!Currently, ETH is forming an ascending triangle, indicating a potential price increase. It is anticipated that the price could rise, aligning with the projected price movement (AB=CD).
However, it is crucial to wait for the triangle to break before taking any action.
Give me some energy !!
✨We spend hours finding potential opportunities and writing useful ideas, we would be happy if you support us.
Best regards CobraVanguard.💚
_ _ _ _ __ _ _ _ _ _ _ _ _ _ _ _ _ _ _ _ _ _ _ _ _ _ _ _ _ _ _ _
✅Thank you, and for more ideas, hit ❤️Like❤️ and 🌟Follow🌟!
⚠️Things can change...
The markets are always changing and even with all these signals, the market changes tend to be strong and fast!!

Ethereum signal Ethereum sell......
Entry .....1814.6
Target..............1800
SL.............1827.7

ETH/USD bearish trend(A Corrective Pullback)The sharp drop from 1,803 created an FVG around 1795–1800, which price is currently filling. A rejection at the bearish order block (1800–1803) could lead to a bearish continuation toward 1790 or lower then expect a bullish reversal targeting 1810–1815. then 1850. & then 1963 & so forth & so on. Watch for confirmation during the London or New York kill zones.
