import pandas as pd import numpy as np import matplotlib.pyplot import pandas as pd
import numpy as np
import matplotlib.pyplot as plt
import yfinance as yf
# Stock data download (for example, Apple stock)
stock_symbol = 'AAPL'
data = yf.download(stock_symbol, start='2020-01-01', end='2025-01-01')
# Calculate Short and Long Moving Averages
short_window = 40
long_window = 100
data = data .rolling(window=short_window, min_periods=1).mean()
data = data .rolling(window=long_window, min_periods=1).mean()
# Generate signals
data = 0
data = np.where(data > data , 1, 0)
data = data .diff()
# Plotting the data
plt.figure(figsize=(12,6))
plt.plot(data , label='Close Price')
plt.plot(data , label=f'{short_window} Days Moving Average')
plt.plot(data , label=f'{long_window} Days Moving Average')
plt.scatter(data.index [data == 1], data [data == 1], marker='^', color='g', label='Buy Signal', alpha=1)
plt.scatter(data.index [data == -1], data [data == -1], marker='v', color='r', label='Sell Signal', alpha=1)
plt.title(f'{stock_symbol} Moving Average Crossover Strategy')
plt.legend(loc='best')
plt.show()
ETHBULLUSD trade ideas

ETHUSD BUY AT DEMAND ZONE SMART MONEY CONCEPTHere on ETHUSD price form a demand zone around level of 3194.70 and is likely to continue buy so trader should go for long and expect profit target of 3565.71 and 4047.64 . Use money management

Let's go!I warned you in November that December would be a difficult month for Ether and crypto, now probably, we'll have a breathtaking February and March, be prepared!

Scenario on ethusd 23.1.2025On this chart, sfp has formed under low, which makes sense for me to think about a bullish scenario, the best scenario is that the price will return to dialy vwap where there is strong support and also the fibo level here, I would like to enter a long position on the new ath, on the contrary, if the price broke through this support, the second sfp below the low is quite likely

ETH | Next Goal $8,000 | iHnS | CUP & HandleHere we're looking at what seems to be a inverted HnS pattern developing inside the Handle portion of the C&H pattern
Crazy...right?
Usually I like to use these at the bottom of a trend similarly to my KRAKEN:BEAMUSD analysis but in this case price structure is holding up above $2,500 - $3,000 which still makes price action very bullish especially that we haven't really been rejected by resistance as yet
Instead what we're experiencing is a large price consolidation swinging in between a 60% range with buyers accumulating at the low end
I'm looking to see a price fall of around 8% to complete this falling wedge pattern (RS) then a breakout around mid February sending price back to the top end range of this consolidation
Next step in price action we want to whiteness a clean break above $4,800 resistance (100% Fib Ex) to then create a pullback trigger around that area for a Buy-High Sell-High strategy
(entry #2)
If successful we can see a trajectory just under $8,000 ETH!
This TA lines up with my large ABCDE Triangle pattern mentioned in the video with a overall target of $15,000 ETH for the next ALT season.

Ethereum Weekly Chart AnalysisEthereum Weekly Chart Analysis
Key Observations:
Price Action and Fibonacci Extensions:
Ethereum's price is consolidating near the 0.618 Fibonacci retracement level (~$3,445), with a bullish structure forming.
Upside targets include:
1.618 extension (~$4,502): Short-term target for continuation.
2.618 extension (~$5,433): A mid-term target aligned with prior resistance zones.
3.618 extension (~$6,328) and 4.618 extension (~$7,210): Long-term targets for a sustained breakout.
Trend Indicators:
Moving Averages:
Price is trading above the 50-week EMA (blue) and 200-week EMA (purple), signaling long-term bullish momentum.
The 20-week EMA (orange) is holding as dynamic support, further confirming bullish sentiment.
Recent crossover between shorter-term and longer-term moving averages suggests momentum is strengthening.
Volume:
Declining volume during the consolidation phase implies sellers are exhausted.
A breakout above $3,445 with increased volume could confirm the next bullish leg.
Support and Resistance Levels:
Support Zones:
$3,155 (20-week EMA).
$2,747–$2,475: Strong historical support aligned with the 200-week EMA.
Resistance Levels:
$4,116: Local resistance near prior highs.
$4,820–$5,433: Key zones for bullish continuation.
Divergences:
RSI: Currently neutral (~51), showing room for upward movement without overbought conditions.
ASO (Advanced Stochastic Oscillator): Shows bullish momentum with no clear reversal signal, supporting higher price potential.
Cycle Analysis:
Right Translated Weekly Cycle:
Recent cycle highs have occurred after the midpoint, confirming a bullish bias.
A Weekly Cycle Low (WCL) may have recently formed, acting as a base for further upside.
If Ethereum follows this Right Translated pattern, the next move is likely a higher high.
Trade Outlook:
Bullish Scenario:
A breakout above $3,445 could push Ethereum toward $4,500 and beyond.
Ideal entries are near $3,155–$3,445, with stops below the 200-week EMA (~$2,475).
Bearish Scenario:
A breakdown below $3,155 may lead to retests of support near $2,747–$2,475.
Invalidation of the bullish structure would occur below the 200-week EMA.
Summary for the Post:
Ethereum remains in a bullish structure with strong support from major moving averages and cycle patterns.
Upside targets include $4,500, $5,433, and potentially $6,328 if momentum continues.
Watch for a breakout above $3,445 with volume to confirm bullish continuation, but manage risks with stops below $3,155 or $2,475.

$2800 is imminent for ETH$2800 is imminent for ETH
It seems the buy has started cooling off.
From my analysis, I see ETH hitting $2.8K if the lack of a buying catalyst comes into play soon.
On daily charts as displayed, you will notice the downward pattern
Trade with care

Ethereum (ETH/USD) on a daily timeframe, AnalysisThis chart illustrates Ethereum (ETH/USD) on a daily timeframe, where the price is consolidating within a broad horizontal range between approximately $2,000 (support) and $4,800 (resistance). A descending trendline from the most recent highs suggests bearish momentum, with price currently rejecting this resistance.
Key observations:
1. **Volume Decline**: The declining volume indicates weakening market participation, which may support a continuation of the downward trend.
2. **Bearish Bias**: The chart suggests a potential move toward the lower boundary of the range ($2,000) if the descending triangle pattern plays out.
Conclusion: If the price breaks below interim support (around $3,000), ETH could potentially test the $2,000 zone. A confirmed breakout above the trendline would invalidate the bearish scenario. BINANCE:ETHUSD

It's disappointing !!!Once again, The price action could drop to $3060 and then return to its peak. It will take some time to recover from the damage that these sh*t meme coins have done to the crypto market.
Give me some energy !!
✨We spend hours finding potential opportunities and writing useful ideas, we would be happy if you support us.
Best regards CobraVanguard.💚
_ _ _ _ __ _ _ _ _ _ _ _ _ _ _ _ _ _ _ _ _ _ _ _ _ _ _ _ _ _ _ _
✅Thank you, and for more ideas, hit ❤️Like❤️ and 🌟Follow🌟!
⚠️Things can change...
The markets are always changing and even with all these signals, the market changes tend to be strong and fast!!

ETHEREUM trapped between MAs but preparing a massive surge.Ethereum (ETHUSD) has been trading since the start of the year within the 1D MA50 (blue trend-line) and 1D MA200 (orange trend-line). Despite this technical 'trap', there are two bullish patterns that outweigh this range and those are primarily the Channel Up since the July 18 2022 market bottom and in the last 10 months an Inverse Head and Shoulders (IH&S) pattern.
The latter is in the process of forming the Right Shoulder and as long as the 1D MA200 holds, it should complete it within 6 weeks maximum. On top of that, we have a recently formed 1D Golden Cross and in terms of 1W RSI, we are on similar grounds as January 2024.
On all cases, a strong rally followed in the form of the Channel's Bullish Leg. Assuming it follows the technical target of the IH&S, we are expecting a peak on the 2.0 Fibonacci extension at $7400.
-------------------------------------------------------------------------------
** Please LIKE 👍, FOLLOW ✅, SHARE 🙌 and COMMENT ✍ if you enjoy this idea! Also share your ideas and charts in the comments section below! This is best way to keep it relevant, support us, keep the content here free and allow the idea to reach as many people as possible. **
-------------------------------------------------------------------------------
💸💸💸💸💸💸
👇 👇 👇 👇 👇 👇

Ethereum (ETH) - ATH Break-Out - Bullish CycleMARKETSCOM:ETHEREUM gave me a whooping 170% #Profit on the #Bullish Swing.
I went #Long on BITSTAMP:ETHUSD from the 1.6K Mark, on the #Break-Out.
I cashed it all in on the 3.5-4K Range.
* see related idea for details.
Unlike MARKETSCOM:BITCOIN , CRYPTOCAP:ETH did not deliver a new #ATH.
In fact, it all leads to the fact that it's waiting for something.
With the $BitcoinDominance ( CRYPTOCAP:BTC.D ) showing signs of an up-coming #Correction, I believe this will pave the way for #Altcoins to shine, thus the #Altseason to start.
Crypto Market Cap ( CRYPTOCAP:TOTAL2 & CRYPTOCAP:TOTAL3 ) are about to burst on the #Bullish side.
BINANCE:ETHUSDT will play a major role in this.
* see related ideas for details.
What's the Play for MARKETSCOM:ETHEREUM ?
I see a strong #ETH #Bull in Cycle Wave C (turquoise).
This can easily reach 5K, but can also tag the 7K Mark.
BITSTAMP:ETHUSD #TechnicalAnalysis
- #ElliottWave Cycle Wave C (turquoise)
- Inverted #HeadandShoulders
- #RunningFlat
My CRYPTOCAP:ETH #BUY Levels
- Entry @ 3.1K
- SL @ 2K
- TP @ 5K

eth ath, unpopular opinionthe amount of hate eth is getting same time every cycle and focus turned to solana and meme coins, eth and utility plays will soon perform very well. same thing happens every cycle eth is slow then all of a sudden it just pumps and alt season is here.
the left chart is the monthly which is getting ready to breakout, and the right side is the 2week inverse h/s .chart both charts look good, just because its moving slow as it always does doesn't mean its bearish, the monthly 21 average is holding just find and the 2 week 21 average is perfectly intact. a lot of confluence here be ready for an eth rally and alt season very soon. utility plays on eth will be low risk high reward then the casino on solana with high risk high reward.
eth will break to new all time highs.

ETH MoveBINANCE:ETHUSDT should show a positive breakout from here with a confirmation for bullish trajectory to $3800s.

$24 ETH?TradingView's auto chart patterns are showing a rising wedge with a target of $24.5
Crypto washout coming?

Target: $3800. Local review of the pair Eth/Usd 19.01.25Good evening, dear friends!
Local review of eth/usd pair from 19.01.25:
On ether I don't see any prerequisites for working from a short. The price is currently moving inside the local “triangle”, compressing the spring. The main volume level is marked in yellow color. If it is broken and, in case there is no excessive supply of sellers ~3500$, I expect the up-trend to continue on aggressive purchases to the price range of 3750-3850$.
The second scenario, unlikely:
Breaking through the lower accumulation boundary and going beyond $3072. This would indicate the strength of sellers and lack of sufficient buyer demand. That is where we should have a stop-loss on the position.
Translated with DeepL.com (free version)

#ETH/USDT Ready to launch upwards#ETH
The price is moving in a descending channel on the 1-hour frame and sticking to it well
We have a bounce from the lower limit of the descending channel, this support is at 3200
We have a downtrend on the RSI indicator that is about to break, which supports the rise
We have a trend to stabilize above the moving average 100
Entry price 3325
First target 3410
Second target 3530
Third target 3650

Ethereum short term gain and next year priceMARKETSCOM:COINBASE : BINANCE:BTCUSDT KCEX:TRUMPUSDT ETHUSD Ethereum short-term gain and next year's price. a double journey

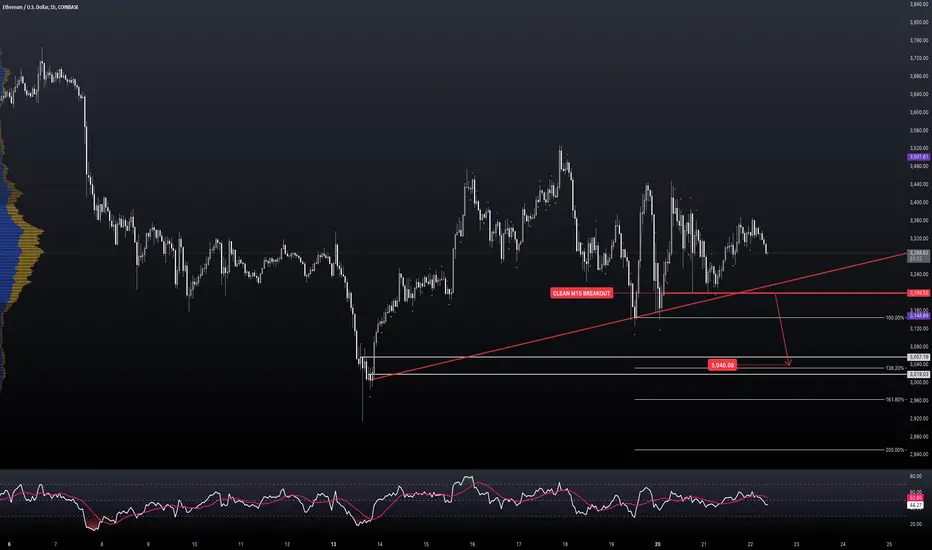
ETHEREUM // short ideaThe correction is still valid, and this is a risky bet, but if the price breaks below this M15 breakout significantly, the market my revisit the recent valley.
———
Orange lines represent impulse bases on major timeframes, signaling the direction and validity of the prevailing trend by acting as key levels where significant momentum originated.
Level colors:
Daily - blue
Weekly - purple
Monthly - magenta
H4 - aqua
Long trigger - green
Short trigger - red
———
Stay grounded, stay present. 🏄🏼♂️
<<please boost 🚀 if you enjoy💚
Momentum Strategy 4 HRLooking at this charts pattern, its on a sideways/downtrend currently> Shows a big downward movement, buyers come back push it to the FMV, than begins a drop base, should drop again. Still has a ways to go to get to the controlling demand zone.

ETHUSD - Weekly Forecast - Technical Analysis & Trading IdeasMidterm forecast:
While the price is above the support 2726.71, resumption of uptrend is expected.
We make sure when the resistance at 4100.00 breaks.
If the support at 2726.71 is broken, the short-term forecast -resumption of uptrend- will be invalid.
Technical analysis:
The Falling Wedge taking shape and as a bullish pattern suggests we will soon see another leg higher if price breaks and closes above downtrend.
A trough is formed in daily chart at 2908.80 on 01/13/2025, so more gains to resistance(s) 3508.51, 3695.27 and maximum to Major Resistance (4100.00) is expected.
Take Profits:
3695.27
4100.00
4500.00
4868.00
__________________________________________________________________
❤️ If you find this helpful and want more FREE forecasts in TradingView,
. . . . . Please show your support back,
. . . . . . . . Hit the 👍 BOOST button,
. . . . . . . . . . . Drop some feedback below in the comment!
🙏 Your Support is appreciated!
Let us know how you see this opportunity and forecast.
Have a successful week,
ForecastCity Support Team

Wedge Breakout Soon?CRYPTOCAP:ETH #Ethereum still inside descending wedge. Key level to break is 3.5k. 4k TP if it closes above top of wedge and 3.5k level.

ETH 50% BOOM📈 Overall Trend: The chart indicates significant fluctuations in the price of Diaocesan against the US Dollar. The price started at around 5400 units and has gradually decreased over time.
🛡️ Support and Resistance Levels:
Support Level: The price has reached around 2140 units at several points, which can be considered a support level.
Resistance Level: The price reached around 5400 units at the beginning of the period (April 2024), which can be considered the main resistance level.
📉 Recent Fluctuations: In recent months, the price of Diaocesan has been declining, reaching around 2140 units. This decrease may indicate strong selling pressure or reduced demand for this currency.
🔮 Forecast:
Given the recent downward trend and price decline, we may see this trend continue in the short term. However, if the price reaches a strong support level, we might witness a price rebound or stabilization. Traders should look for signs of a trend reversal or a breakdown of the support level to make their trading decisions.
📊 This analysis is based on the information available in the image, and for more accurate decision-making, further examination and the use of technical and fundamental analysis tools are recommended. 🛠️📉📈

ETH/USD Analysis: Trading Opportunity in Real TimeHello, traders! Today, I'm testing some premium indicators on TradingView for the ETH/USD pair with a 1-hour timeframe. 🚀 I'm using tools like the Support & Resistance Matrix, Market Prediction Indicator, and Trend Navigator to find the best opportunities.
📌 Trade Details:
Entry: $3,311.07 (latest signal).
Take Profit: $3,400.00 (projected resistance zone).
Stop Loss: $3,237.44 (key support zone according to the indicators).
The Trend Navigator is still showing a bullish trend, and even though I’ve already taken the latest signal, there’s still time to analyze this opportunity! 📈 The projection indicates a potential upward movement, and we are well-positioned to take advantage of it if the price maintains this momentum.
🔥 My analysis: If we respect the blue trend line and hold the nearby support, the target is achievable. But always remember to manage risk and adjust your stop loss to protect capital.
What do you think of this entry? Leave me your comments, and don’t forget to like for more trading content! 🎥✨"
