Wajani Investments: ETHUSD AnalysisPair is currently at demand zone acting as a strong support become resistance zone as shown. Price has also made it first LH at current price. In addition, a wedge is formed which is usually a reversal pattern as shown. All these factors point to the fact that this pair is done shorting and the bulls are ready to take the market up.
Let me know your thoughts.
Thank you.
ETHBULLUSD trade ideas

BUY ETHUSDETHUSD technical analysis is aligning with fundamentals. We have seen a breakout from the channel, I am expecting price to pump up into 2080 before Monday. Huge entities like Black Rock are purchasing huge amounts of ETH, let us follow my fellow retailers

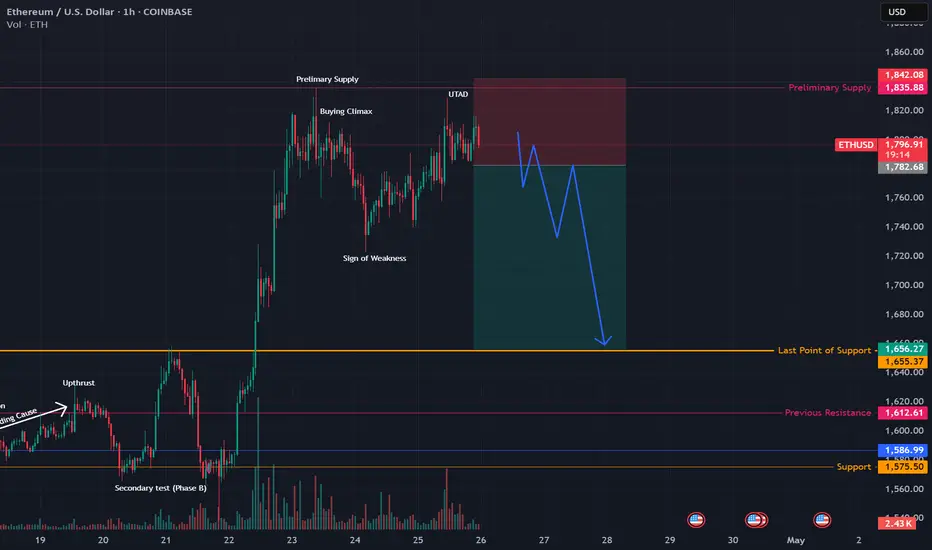
ETH Showing Weakness in Wyckoff DistributionLooks like we may see a nice pull back this weekend. Price has failed to break the labeled Buying Climax and is showing signs of a reversal. Retracement could be back to the last point of support around $1655. Here it can accumulate and continue its up move. I have posted a Idea targeting $2700, I still think this could be in play
Short-Medium Recovery For ETHUSDInverted H&S reversal likely building. Bearish continuation structure on Left Shoulder likely sees a mirroring effect here, synchronicity is common in shoulder formations and makes for a stronger neckline.
Targeting 2392 (+25%) should we get a meaningful break of 1820 level.
Trade Status - Pending. Likely to chop around a bit more first (see potetnial left shoulder formation). Look for tightening volatility compression for more optimal entry.

ETHEREUM BULLISH SIGNALMAKE SURE YOU MANAGE A PROPER RISK REWARD RATIO THIS IS A GOOD ENTRY FOR LONG WITH ETH. PRETTY BULLISH
As of April 25, 2025, Ethereum (ETH) is trading at approximately $1,811.85, reflecting a 2.3% increase from the previous close. The intraday high reached $1,820.32, while the low was $1,744.49.
Looking ahead, Ethereum is poised for significant growth, with projections suggesting potential price levels ranging from $5,000 to $14,000 by the end of 2025. These optimistic forecasts are underpinned by several key factors:
Institutional Adoption: The approval of Ethereum ETFs is expected to attract substantial institutional investment, enhancing liquidity and market confidence.
Bitsz
Technological Upgrades: Upcoming enhancements, such as the PECTRA upgrade, aim to improve scalability and efficiency, making Ethereum more attractive for decentralized applications and enterprise solutions.
The Currency analytics
+1
Bitsz
+1
Regulatory Clarity: Anticipated regulatory developments, including clearer guidelines on staking and potential favorable policies, could bolster investor confidence and adoption.
MarketWatch
While the current price is below its all-time high, Ethereum's foundational role in decentralized finance (DeFi), smart contracts, and NFTs positions it for substantial appreciation in the coming months.
In summary, Ethereum's bullish outlook is supported by strong institutional interest, ongoing technological advancements, and a favorable regulatory environment, suggesting a promising trajectory toward new all-time highs in 2025.

The end of seasonal growth, reducing work positionsThe seasonal growth cycle is ending this week. For most of the market, the sales cycle begins on Sunday. In the new week, we can still expect pumps for the turn of the month for individual coins. From Sunday to Tuesday, the probability of a market drawdown prevails as part of a pullback on the current weekly candle and shadow rendering for the new week. For coins that have already attempted to turn the month around, the probability of stable sales until the end of May already prevails from this week. From Tuesday to May 7-9 or 11-12, there will still be a flat period, when, with a general market pullback, individual coins may show growth, then the probability of a return of ether to 1500-1600 prevails, with a possible reversal and drawdown of the altcoin market. Today and tomorrow, I recommend reducing positions on coins, especially those that have shown good growth, in order to avoid drawdowns in the new month.
In the first half of the new week, growth impulses for coins that have not yet attempted to turn the current monthly candle into a bullish one are more likely. In particular, pumping is possible using vib wing and pda, which are awaiting delisting. For coins without the monitoring tag, it is better to make further purchases after the announcement of the tag assignment in the new week, because after the rollback from Sunday to Tuesday, coins can lose up to 50% additionally in the second half of the week if the tag is assigned. I will collect the list of coins for work in May after the announcement of the tag assignment.

one last dancegm.
you finally woke up and ethereum was soaring.
you saw the bounce. the reclaim. the headlines.
you convinced yourself the bottom was in.
you drew trendlines, watched influencers say “we’re so back.”
you wanted to believe.
and that’s exactly what wave B needed.
because this wasn't a breakout.
it’s a reset.
a psychological rinse,
engineered to bait late longs and build fuel for the final l i q u i d a t i o n.
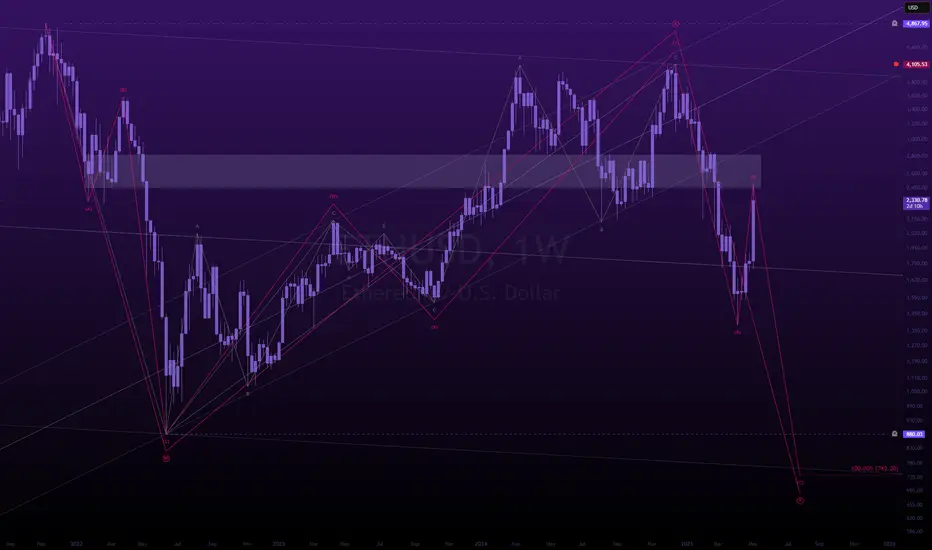
this is the macro (W)-(X)-(Y).
not hopium, not dreams structure.
wave A brought devastation.
wave B brought complacency
wave C brings the execution.
make no mistake:
we’re not going up,
we’re being set up.
the chart says $742.
you call it impossible.
but the market doesn’t care what you believe.
the market only exists to find the maximum pain,
your maximum pain.
eth to $700 is not a prediction.
it’s a scheduled event.
and you’re RSVP’d unless you wake up.
wave C of wave (Y) is coming.
and it doesn’t care how bullish you feel.
---
ETHUSD INTRADAY bullish breakout supported at 2,190The ETH/USD pair maintains a bullish overall sentiment, underpinned by a sustained upward trend.
Key Levels:
Support: 2,190 (primary), followed by 2,123 and 2,046
Resistance: 2,625, with extended targets at 2,725 and 2,850
A corrective dip toward the key support zone at 2,190 could offer a bullish rebound opportunity. A successful bounce from this level would reinforce the uptrend and pave the way for a test of the 2,625 resistance. A breakout above this level may open the door to further gains toward 2,725 and 2,850 over the longer term.
Conversely, a decisive break and daily close below 2,190 would invalidate the bullish setup, potentially triggering a deeper pullback toward the 2,123 and 2,046 support levels.
Conclusion:
While the broader trend remains bullish, ETH/USD is currently consolidating. Traders should watch the 2,190 support closely—its defence may confirm trend continuation, while a breakdown could signal a short-term bearish reversal.
This communication is for informational purposes only and should not be viewed as any form of recommendation as to a particular course of action or as investment advice. It is not intended as an offer or solicitation for the purchase or sale of any financial instrument or as an official confirmation of any transaction. Opinions, estimates and assumptions expressed herein are made as of the date of this communication and are subject to change without notice. This communication has been prepared based upon information, including market prices, data and other information, believed to be reliable; however, Trade Nation does not warrant its completeness or accuracy. All market prices and market data contained in or attached to this communication are indicative and subject to change without notice.

add to the watchlist, after bullish wave of btc, eth is next2048-2440 Strong resistance levels, upbrake of the trend will pump etherium to the target. invalidation level is important it is half of the current price. patience will create gain opprtunity on this one.

massive breakoutGuys massive breakout
It's going to collect after ethereum news of so called halving
still 50% off from beginning of year

ETHUSD Long (UPDATE)The run is continuing on ETH.
CRYPTO seems to be on run across the board with BTC over $100K

$ETH 20% Move With 20/50DMA CrossoverHOLY MOLY!
Over 20% gain for CRYPTOCAP:ETH on the day
20DMA making a bullish crossover the 50.
Next target at the .382 Fib ~$2400
Did Pectra actually work?
And is Ethereum back from the dead !?

ETH buying zoneBuying Eth now :-
fakeout of monthly support zone
currently at above support level
Targetting recent ATH as TP1 and 30,000/ETH for long run

If Ethereum behaves like $BTCIf Ethereum behaves like CRYPTOCAP:BTC , which after breaking through the downward channel continued to grow without a rollback, then soon we will see our Favorite Ether at $2500.
The altcoin season will come after the growth of Ether, but there will not be enough Liquidity for everyone!
Projects that are alive, working, and earning will grow.
Projects should have realized - It's time to take responsibility and independently ensure the Liquidity of their Tokens at the expense of income from the Business Model, and not live at the expense of VCs with a printing press.
#RateXAI #RAA token

ETH USD HH and HL Bullish Trend.ETH USD HH and HL Bullish Trend. represent the hammer candlestick pattern at the HL Position represent the bullish reversal signal and using it as a basis of my long (buy) position at the market price.

Eth going sideways is still positiveHi guys, eth is going sideways but believe it or not it's actually a positive move.
it shows an equal amount of buying and selling to create this movement, the division is accurate.
Eth has great potential sitting at an all time low of five years. If you believe in eth, then get on board. As Warren Buffet would say, If you would buy coca cola at $50 why wouldn't you buy it at $30
Please hit the boost for me it helps, and follow I post often.
Have a good day all.

ETHEREUM: Will Go Up! Long!
My dear friends,
Today we will analyse ETHEREUM together☺️
The price is near a wide key level
and the pair is approaching a significant decision level of 1801$ Therefore, a strong bullish reaction here could determine the next move up.We will watch for a confirmation candle, and then target the next key level of 1810$ Recommend Stop-loss is beyond the current level.
❤️Sending you lots of Love and Hugs❤️

AI Prediction ETH/USD for 24 hour! Intraday trading!May 5, 2025 6:36 pm. ETH/USD. ETH/USD Trading Plan
Long Scenario
- Entry: $1,815 (confirmed by Supertrend long + RSI rising above 40).
- Stop-Loss (SL): $1,790 (below $1,800 support).
- Take-Profit (TP): $1,840 (below $1,850 resistance).
- Trailing Stop: 13 points (2x ATR).
Short Scenario
- Entry: $1,795 (confirmed by breakdown below $1,800 + MACD bearish crossover).
- Stop-Loss (SL): $1,820 (above $1,810–$1,820 resistance).
- Take-Profit (TP): $1,750 (above $1,780 support).
- Trailing Stop: 13 points (2x ATR).

Ehterium Day Trade 06/05/2025 - 02:26 AMEthereum short setup
Entry: $1815
Target (TP): $1762
Stop-Loss (SL): $1833
Let’s break down the trade:
🔍 Risk-Reward Ratio
Risk: 1855 - 1815 = 40 points
Reward: 1815 - 1762 = 53 points
Risk-Reward Ratio (RRR) = 53 / 40 = 1.32
This is a moderately good RRR—above 1, so it's acceptable for short-term trades. Higher RRR (like 1.5 or 2) is usually more favorable.
✅ Pros:
Clear structure with defined entry, TP, and SL.
SL is above a likely resistance zone (safe).
TP is near recent support (realistic).
⚠️ Cautions:
Ethereum can be volatile, especially with upcoming macroeconomic news or BTC movements.
Watch for price action near $1800—if it consolidates there, it could signal indecision.
Consider setting a trailing SL if price moves favorably toward $1780+.

ETH Long term StrategyEthereum will not hold as this price due to BTC being bearish. Looking for long entry below 1625 and SL below the 1538.75 red candle. No money to be made going long. Trade responsibly. Enjoy

ETH/USD Rejected at $1,871 – Is $1,413 the Next Target?Ethereum just got rejected from a major supply zone near $1,871, and we’re now seeing early signs of bearish pressure setting in. Price has failed multiple times to break and hold above this key resistance.
Key Levels & Analysis:
Supply Zone: $1,850 – $1,875 (strong historical resistance with visible range volume)
Immediate Support: $1,655 – could act as a short-term bounce zone
Major Demand Zone: $1,413 – price has reacted strongly here before, making it a crucial level to watch
Current Bias:
Bearish below $1,850. ETH has printed a possible double top, with sellers defending the zone aggressively.
Trade Idea:
Consider short setups if price retests and fails to break above $1,850 again. Look for a move toward $1,655 first, then potentially to $1,413 if volume supports the drop.
Upcoming Catalysts:
Watch out for upcoming U.S. economic data releases (highlighted below the chart), which could cause volatility.
Question for Traders:
Do you think ETH will bounce at $1,655 or break straight down into the $1,400s?
---
Hashtags:
#Ethereum #ETHUSD #Crypto #SupplyAndDemand #LuxAlgo #TradingStrategy #TechnicalAnalysis #CryptoTraders #FrankFx #ETH4HChart

ETH +15% Follow for more tips"ETH is at a critical level — next stop $3K or major rejection incoming? 🔍 What's your take — breakout or breakdown? Share your charts and thoughts below 👇"

Ethereum Bulls Poised: $1875 Resistance Key to Next Leg UpETHUSD forms double top around $1875 and showed a minor sell-off. It hits an intraday low of $1816 and is currently trading around $1834.
Overall trend remains bullish as long as support of $1500 remains intact. The key near-term resistance is at $1875 (trend line joining $4109 and $3746) any breach above targets $2000/$2300/ $2500/$2770/$3000/$3400/$3600/$3800/$4000. A robust bullish trend will only materialize above $4100.
Immediate support is around $1675. Any violation below will drag the price down to $1620/$1500/$1200/$1000. A breach below $1000 could see Ethereum plummet to $800/$500.
It is good to buy above $1875 with SL around $1500 for a TP of $2770/$3000.
