Ethereum Hits Critical Resistance — Is a Drop to $1400 Next?Introduction
Ethereum has been in a sustained downtrend over the past weeks, struggling to gain any real bullish traction. After a sharp decline last Sunday, the market remains under pressure, and although we’ve seen short-term attempts to recover, the broader trend still points downward. Technical indicators and price structure suggest this may not be over, with both Fibonacci levels and momentum oscillators hinting at further downside potential.
Resistance from the FVG and Fibonacci
Last Sunday, Ethereum dropped over 10% in a single move, forming a large 4-hour Fair Value Gap (FVG) in the process. This gap signaled a strong imbalance between buyers and sellers, with sellers clearly in control. Earlier this week, ETH managed to retrace up to the 50% level of that FVG but faced immediate rejection, highlighting the strength of the resistance. Currently, price is once again moving into the FVG zone and has reached the golden pocket Fibonacci level between $1650 and $1664. This area often acts as a key pivot for price direction. If bulls manage to break through, the next logical target would be the 0.786 Fibonacci retracement at $1724, potentially completing the fill of the FVG.
Stochastic RSI weakening on the daily timeframe
While the short-term price action shows some bullish effort, the daily Stochastic RSI tells a different story. It has now almost entered the overbought zone, suggesting that Ethereum’s current upward move may be running out of steam. This indicator often precedes a shift in momentum, and if history repeats itself, we could soon see bears stepping back in. With ETH still unable to break recent highs, the setup favors a continuation of the downtrend. If selling pressure resumes, we could be looking at a move down to the $1400 level, or potentially even lower.
Thanks for your support.
- Make sure to follow me so you don't miss out on the next analysis!
- Drop a like and leave a comment!
ETHBULLUSDT trade ideas

Trading Update – ETH/USD – Lord MEDZ Ethereum has tapped into a key breaker block on the weekly timeframe. This level has historically acted as a springboard for major moves. The confluence of demand in this zone suggests a high-probability reversal setup in play.
Support Zone: $1,795 - $1,832 (Order Block)
Current Price: $2,074
Target: $4,093+ (97% upside potential)
Stop Loss: $1,795 (Risk ~13.45%)
Risk/Reward Ratio: 7.23
Worst case, if the breaker fails then we could see a test of the order block below.
The strategic cryptocurrency reserves by the money-printing machine (USA) add another layer to this thesis. This could be the shakeout before the next major rally.
Stay patient, manage risk, and let price action confirm the move.

ETH/USDT Price Action Update – by Lord MEDZMarch 29, 2025
(Not financial advice)
Price has moved down from GB83, but based on current structure, GB83 may not be a rejection point — it could be the Sign of Strength (SOS) in a broader Wyckoff Accumulation.
That means the move down toward GB59 ($1,284) isn’t necessarily weakness — it could be a Last Point of Support (LPS) or even a final spring test before a potential mark-up phase begins.
Current View:
GB83: Potential Sign of Strength (SOS) – a strong move above prior structure followed by a controlled retrace.
Weekly Distribution Candle: Formed near the low, currently expanding downward. This aligns with distribution behavior, but within accumulation context, this could be part of the final test.
GB59 ($1,284): Still valid as the Goldbach pathway termination, and now a critical support to confirm the LPS/spring narrative.
Wyckoff Context:
If GB83 = SOS → GB59 = LPS
A bounce and structure reclaim from GB59 would validate the larger accumulation thesis
Failure to hold GB59 would put that theory at risk
Bias:
Short-term: Bearish pressure still in play
Mid to long-term: Bullish bias intact if GB59 holds as support
Summary:
GB83 may be the SOS, not the top
GB59 is a key reaction zone
Structure still fits within Wyckoff Accumulation
Watching for a bounce and reclaim to confirm LPS → mark-up
Lord MEDZ Final Word:
“If GB59 holds, this isn’t distribution. It’s preparation.”

EthRetracement opportunity
High probability the price may make shape for and inverse HnS
RSI not overstretched

ETH SHORT TERM If the uptrend continues and we see a bullish Total chart (i.e. we get volume support) then this pose will work.
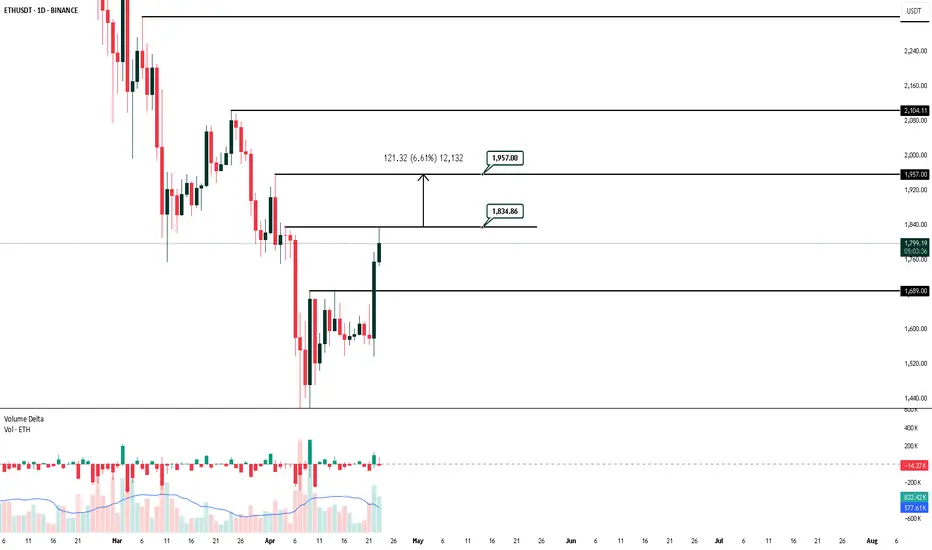
ETH gives a strong exit from the descending channel!Hello everyone, I invite you to review the current situation on ETH, because you can see a significant rebound at the level of 30% from the last low. When we enter the four-hour interval, we can see how the ETH price moved in the local downtrend channel, from which we got an exit at the top, such a scenario often gives increases at the level of the channel height, which would bring the price closer to the levels of $ 2100.
Here you can see how the current rebound brought the movement closer to the resistance at the level of $ 1830, and then resistance is visible at the price of $ 1950, where the ETH price must then face a strong resistance zone from $ 2060 to $ 2100, where there could potentially be an upward movement after leaving the channel as in this case.
Looking the other way, you can see that when the trend reverses, we first have support at the level of $ 1730, but if it is broken, the ETH price may continue to fall and return to a strong support zone from $ 1480 to $ 1380.
It is worth paying attention to the MACD and RSI indicators because you can see how in the 4H interval we have gone beyond the upper limits of the ranges, which may translate into visible price consolidation on the chart in order to cool the situation.

5 RREthereum seems to be a very good long at these levels, with potential targets much higher than those indicated. May not come down to the entry.

ETH Rejection Incoming? Don’t Fall for This Bull TrapYello Paradisers, are you watching how ETH is reacting right now at this key zone? This could either turn into a textbook bearish setup… or catch everyone off guard. Let’s break it down 👇
💎ETHUSDT is currently hovering at a critical resistance area, perfectly aligned with both a key Fibonacci retracement zone and the 200 EMA—classic confluence. What makes it even more concerning is the bearish divergence, which is strengthening the probability of a downside rejection from this level.
💎To add fuel to the fire, the price action has just taken liquidity (inducement) above the previous highs, another bearish signal that supports the idea of a potential reversal from here.
💎However, this bearish bias will be fully invalidated if ETH manages to break and close a candle above the resistance zone. That kind of price action would suggest strength from buyers and a likely continuation to the upside.
💎In that case, it’s wiser to stay patient and wait for a cleaner setup at a better price. Rushing into a trade at this stage, especially in a moment of indecision, is not how pros operate.
If you want to be consistently profitable, you need to be extremely patient and always wait only for the best, highest probability trading opportunities.
MyCryptoParadise
iFeel the success🌴

ETH-----Buy around 1715, target 1800 areaTechnical analysis of ETH contract on April 23: Today, the large-cycle daily level closed with a big positive line yesterday, and the K-line pattern continued to rise. The price stood above the moving average, and the attached indicator was running in a golden cross. The current rise in the big trend is obvious. The previous high pressure position of 1700 is currently converted into the support position below, so the main idea is to keep retracement and do more; the short-term four-hour chart K-line pattern continued to rise, and the attached indicator was running in a golden cross, but the price deviated from the moving average and returned to the moving average support area of 1715. The hourly chart hit the high point in the morning and then came under pressure. From this point of view, it is likely to be a correction trend during the day, and the strength mainly focuses on the strength of the European session.
Therefore, today's ETH short-term contract trading strategy: sell at the current price of 1790, stop loss in the 1820 area, target 1735-1715 area, buy at the 1715 area, stop loss in the 1685 area, target 1800 area;

ETH - Those levels played out perfectly. I had given ETH TA days ago and updated it again and again.
Now: Look how those level played out nicely.
after a weekend and Easter days full of volatility
void level and last low was rejected very clearly and bullish Divergence in CVD.
Price came up above our 4h key level and went above last highs upper blue TL.
Here was a clear Entry for Long: Above blue TL, AVWAP and OBV structure was broken clearly.
to the POC : 5.5 % 🎯 👌
Look at previous ETH TA and more important at that TA about Alts 2 days ago:
Alts TA:
ETH TA:
Follow for more ideas/Signals.💲
Just donate some of your profit to Animal rights or other charity :)✌️

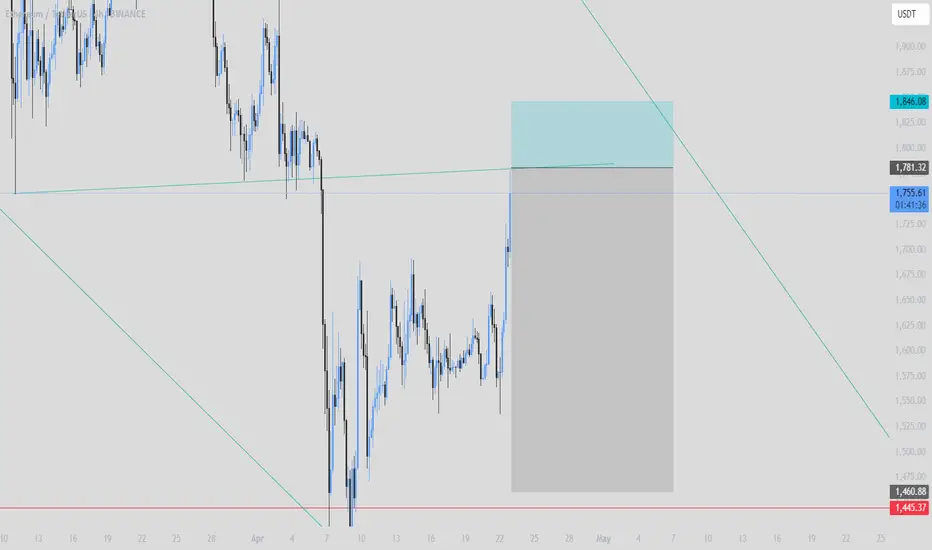
Ethereum UpdateHello traders,
I hope you’re all doing well.
ETH has just reached the potential range I mentioned in our previous update. From this point, a rebound from the current market price is likely. If ETH doesn’t bounce here, then the lower support is expected to hold.
Strategy:
~ Accumulation Range 1: $1400 to $1600.
~ Accumulation Range 2: $1000 to $1200.
~ Target: $3000 to $4000.
Always do your own research and analysis before investing.
Regards,
Dexter.

Risky Scalp Short | $ETH @ CMP 1778 | 5x–7x LeverageHigh-risk scalp short on ETH based on intraday price action and overextension signs.
Trade Plan:
Entry 1: CMP ~1778
Entry 2: 1812
Leverage: 5x to 7x
SL: To be updated (Max 3% risk)
Quick scalp — watch closely for volatility & potential fakeouts.
⚠️ High-risk trade. Not financial advice. For educational purposes only. Use proper risk management.


Ethereum Turns Bullish After SEC Leadership ChangeEthereum Turns Bullish After SEC Leadership Change
On Monday, the SEC announced that Paul Atkins is its new chairman.
Known for his support of crypto, Atkins is expected to push for more favorable regulations in the industry.
This news has sparked optimism in the market, leading to a strong bullish shift in Ethereum.
Traders are now watching closely to see if this momentum continues.
You may watch the analysis for further details!
Thank you!

ETHUSDT : Expecting Another Swing LowEtherium is preparing for another swing low.
Target price 1250-1260, also good price for new entries.
May be the final low before entering a bullish trend, but needs confirmation. Will update.

ETHUSDT Short TermEntry : 1618.80
Take Profit : 1673.54
Stop Loss : 1/2
Don't neglect to apply stop-loss!

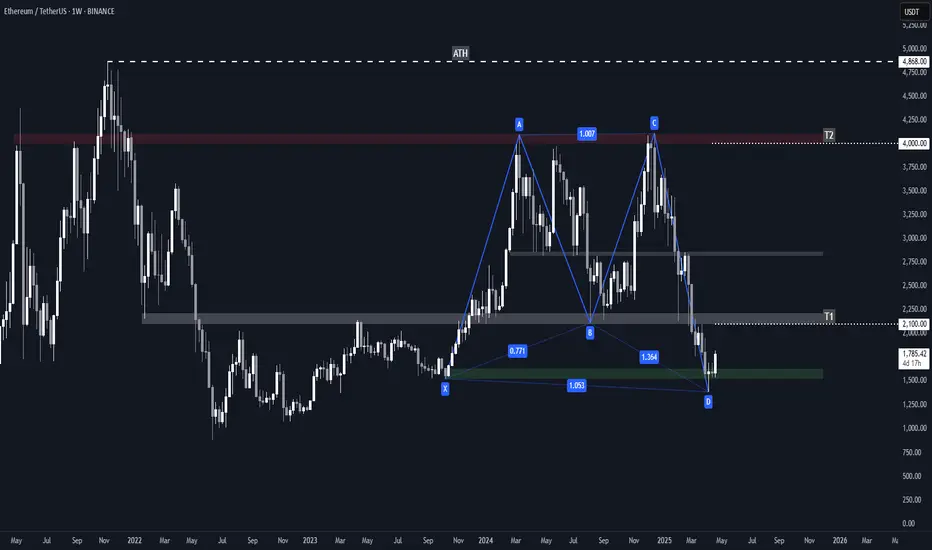
ETH Bullish Navarro 200 Harmonic Pattern + Key Levels / TargetsHarmonic Structure: Navarro 200
Ethereum's weekly chart showcases a fully formed Navarro 200 pattern, identified by:
• A deep B-to-D leg extension (~1.364) — beyond typical harmonic norms, validating the Navarro classification.
• Precise internal Fibonacci alignments:
- XA retracement to B = ~0.771
- BC extension to D = ~1.364
• Completion of point D in a historical demand area around $1500, indicating a potential reversal zone (PRZ).
This harmonic pattern suggests a bullish reversal scenario, contingent on price holding above the $1500 level.
Demand Zone: $1500–$1600
This green box zone represents a major accumulation range from early 2023:
• High volume support — confirmed by prior consolidations.
• On-chain data supports this as a major ETH acquisition zone (1.5M+ ETH bought).
• Current bounce from this area following a liquidity sweep reaffirms it as a strong demand base.
Failure to hold this zone could invalidate the bullish harmonic setup.
Target Zones (Based on Navarro 200 Mechanics)
• T1: $2100–$2200
- Historically significant support-turned-resistance.
- Converges with structural highs and prior breakdown area from mid-2024.
- First logical profit-taking or reaction point following a D-point reversal.
• Mid-Zone: ~$2800
Though not labeled as a target, this is a key supply region to monitor:
- Past consolidations and price rejection.
- Mid-range of the overall pattern.
- Also aligns with prior bullish support in 2024 that flipped to resistance.
• T2: $4000–$4100
- Strong weekly supply zone marked in red.
- Aligns with point C of the pattern.
- Also a psychological barrier near the previous all-time high area ($4,868).
- Likely to see heavy resistance if price rallies that far.
Risks to Watch
• Failure to hold the $1500–$1600 demand zone could send ETH into deeper retracement.
DeGRAM | ETHUSD Holds Above the Demand Zone📊 Technical Analysis
ETHUSDT is in an ascending channel with support at ~$1 580 intact, forming higher lows. It broke above a key trendline, signaling bullish momentum. Above ~$1 660, the next target is ~$1 800. A wedge breakout and firm support reinforce the bullish bias.
💡 Fundamental Analysis
Upgrades like Proto-Danksharding (EIP-4844) are set to boost scalability and cut fees. Spot ETH ETF speculation is driving institutional interest. On-chain activity is rising, and growth in DeFi, NFTs, and layer-2 ecosystems adds to bullish sentiment.
✨ Summary
ETH’s technicals and fundamentals align bullishly, suggesting a rally if key resistances clear.
-------------------
Share your opinion in the comments and support the idea with like. Thanks for your support!

ETH/USDT Falling Wedge Breakout ETH/USDT Falling Wedge Breakout Summary
Ethereum (ETH) against Tether (USDT) has recently broken out of a falling wedge pattern, a bullish technical formation characterized by converging trendlines sloping downward, often signaling a reversal from a downtrend to an uptrend. This breakout, observed on the 12H chart, suggests potential for a significant rally as buying momentum increases.
Breakout Context:
The falling wedge formed as ETH consolidated, with lower highs and lower lows, indicating diminishing selling pressure.
A breakout above the upper trendline of the wedge, as noted in recent market analysis, confirms bullish sentiment, potentially driven by increased buying volume and market optimism.
Price Targets and Resistance Levels:
The breakout has set the stage for ETH/USDT to target several key resistance levels, based on technical analysis and historical price action:
$1,750: A near-term support-turned-resistance level, previously acting as a strong support zone. A retest or consolidation around this level may occur as the price stabilizes post-breakout.
$1,816 ($1,830 zone): This level aligns with a key support/resistance zone within the descending channel. Sustaining above this level is critical for confirming short-term bullish momentum.
$1,948 ($1,950): A significant resistance level identified in recent posts, marking the first major target post-breakout. Breaking this could accelerate upward momentum.
$2,119 ($2,120): The next resistance zone, aligning with prior highs and technical projections. This level may pose a challenge, requiring strong buying pressure to breach.
$2,777 ($2,800 zone): A longer-term target, potentially achievable if ETH breaks through the $2,200-$2,400 resistance zone. This aligns with projections for a rally toward $2,800-$3,000 if momentum persists.
Market Outlook:
Bullish Scenario: For the rally to continue, ETH must hold above $1,830 to confirm the breakout’s strength. A break above $2,200-$2,400 could pave the way for targets at $2,777 and potentially $3,000, as suggested by historical patterns and Fibonacci extensions.
Bearish Risks: Failure to sustain above $1,830 could lead to a pullback toward $1,750 or lower, with $1,600 as a critical support if the breakout fails. Rejection at higher resistance levels ($2,200-$2,400) may also trigger short-term corrections.
Indicators: Bullish divergence on RSI and weakening bearish momentum on MACD support the breakout’s validity, while the 50-day moving average acts as dynamic resistance above current levels.
Conclusion:
The ETH/USDT breakout from the falling wedge signals a bullish shift, with immediate resistance at $1,750 and $1,816, followed by higher targets at $1,948, $2,119, and $2,777. Traders should monitor volume and price action around $1,830 to confirm sustained momentum, while remaining cautious of potential rejections at key resistance zones. For real-time updates, platforms like TradingView or Binance’s ETH/USDT charts can provide further insights.

Short-term uptrend conversion point expected: 1647.06
Hello, traders.
If you "Follow", you can always get new information quickly.
Please also click "Boost".
Have a nice day today.
-------------------------------------
(ETHUSDT 1D chart)
The HA-Low indicator on the 1D chart is formed at the 1647.06 point.
Therefore, the key is whether it can receive support and rise near 1647.06.
-
However, since the M-Signal indicator on the 1M chart is falling near 2500, you should trade with a relaxed mind.
This is because in order to continue the uptrend, the price must be maintained above the M-Signal indicator on the 1M chart.
-
Since the M-Signal indicator on the 1D chart is passing near the HA-Low indicator on the 1D chart, if it rises above 1647.06 and maintains the price, it is likely to turn into a short-term uptrend.
Since the trend line is showing a downward channel and the StochRSI indicator is above 50, the increase is likely to be limited.
Therefore, when the StochRSI indicator shows an upward trend below 50, it is a buying period when the price is maintained above the HA-Low indicator.
If it rises above 1647.06 and continues to rise further, it is expected to touch the Fibonacci ratio of 0.618 (1868.21).
-
Thank you for reading to the end.
I hope you have a successful trade.
--------------------------------------------------
- This is an explanation of the big picture.
I used TradingView's INDEX chart to check the entire range of BTC.
I rewrote the previous chart to update it by touching the Fibonacci ratio range of 1.902 (101875.70) ~ 2 (106275.10).
(Previous BTCUSD 12M chart)
Looking at the big picture, it seems to have been following a pattern since 2015 and has been rising.
In other words, it is a pattern that maintains a 3-year uptrend and faces a 1-year downtrend.
Accordingly, the uptrend is expected to continue until 2025.
-
(Current BTCUSD 12M chart)
Based on the currently written Fibonacci ratio, it shows up to 3.618 (178910.15).
Fibonacci ratio 0.618 (44234.54) is not expected to fall again.
(BTCUSDT 12M chart)
I think it is around 42283.58 when looking at the BTCUSDT chart.
-
I will explain it again with the BTCUSD chart.
The Fibonacci ratio ranges marked in the light green boxes, 1.902 (101875.70) ~ 2 (106275.10) and 3 (151166.97) ~ 3.14 (157451.83), are expected to be important support and resistance ranges.
In other words, it seems likely to act as a volume profile range.
Therefore, in order to break through this section upward, I think the point to watch is whether it can rise with support near the Fibonacci ratios of 1.618 (89126.41) and 2.618 (134018.28).
Therefore, the maximum rising section in 2025 is expected to be the 3 (151166.97) ~ 3.14 (157451.83) section.
To do that, we need to look at whether it can rise with support near 2.618 (134018.28).
If it falls after the bull market in 2025, we don't know how far it will fall, but considering the previous decline, we expect it to fall by about -60% to -70%.
So, if the decline starts near the Fibonacci ratio 3.14 (157451.83), it seems likely that it will fall to around Fibonacci 0.618 (44234.54).
I will explain more details when the downtrend starts.
------------------------------------------------------

Ether short from 1755$Eth deserves no respect for how it has behaved during this bull run. Short this buttcoin.
Basics of trading , resistance hit , it does not break on the first try . I think she will dump again.
BTC Wyckoff Accumulation 1Day chartAs long as the latest geopolitics does not say anything stupid (to be general on all political topics effecting markets) then Wyckoff Accumulation is looking to play out. 🤔👁️🙏🏾🫡🍻💪🏽LFGoOOOOO💰💰💰
