ETHUSDT | Recovery Potential | (April 2025)
ETHUSDT| Long | Liquidity Grab & Recovery Potential | (April 2025)
1️⃣ Short Insight Summary:
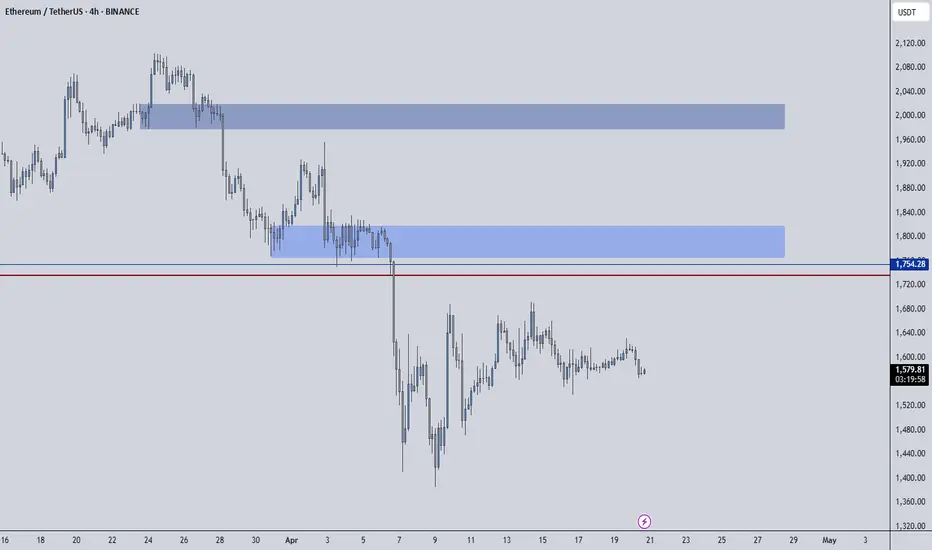
ETHUSDT has been in a steady downtrend for months, but signs now point to a potential reversal. With liquidity likely swept and renewed buying interest around key zones, this could be the beginning of a major move.
2️⃣ Trade Parameters:
Bias: Long
Entry: Around $1,570
Stop Loss: Below the recent liquidity sweep zone (around $1,400–$1,450 depending on risk)
TP1: $2,200–$2,300
TP2: $2,500
TP3: $3,000
TP4: $3,800+
Final Target: $4,000+
✅ Partial profits planned on the way up to manage risk and secure gains.
3️⃣ Key Notes:
Liquidity appears to be fully grabbed below previous lows, which often sets the stage for strong reversals. ETHUSDT is a seasoned project with long-term value and renewed interest. Bitcoin is also showing strength, which may act as a tailwind for altcoins like ETHUSDT. Structure looks favorable, especially for those already in the channel or watching this key zone.
4️⃣ Follow-up Note:
I'll be keeping an eye on this and may post updates if the price approaches key levels or shows signs of invalidation.
Please LIKE 👍, FOLLOW ✅, SHARE 🙌 and COMMENT ✍ if you enjoy this idea! Also share your ideas and charts in the comments section below! This is best way to keep it relevant, support us, keep the content here free and allow the idea to reach as many people as possible.
Disclaimer: This is not a financial advise. Always conduct your own research. This content may include enhancements made using AI.
ETHBULLUSDT trade ideas

ETH/USDTWe can see clear consolidation boundaries. The coin made a deviation below the range, and after returning to the consolidation zone, the targets are set for growth.
Target 1 = 3000
Target 2 = 4500

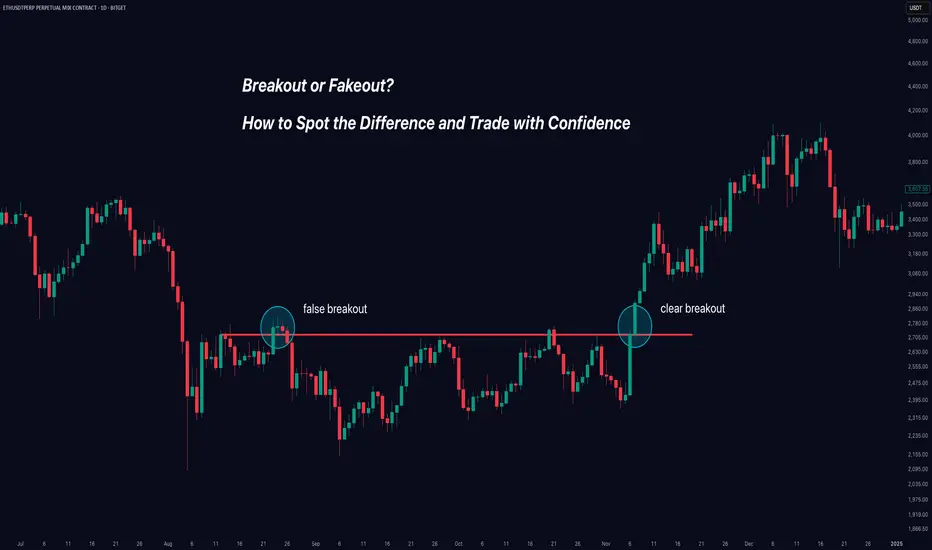
Breakout or Fakeout? How to Spot the Difference and Trade.Trading breakouts can be exciting - and profitable - when they're real. But how do you avoid getting caught in those frustrating false breakouts (fakeouts) that trap many traders?
In this clear and practical guide, you'll learn exactly how to identify genuine breakouts, avoid traps, and improve your trading decisions instantly.
Here's what we'll cover:
✅ Real Breakouts vs Fakeouts: Why it matters.
✅ Market Psychology: Why false breakouts happen.
✅ Volume: Your best friend for spotting authenticity.
✅ Price Structure & Context: When breakouts mean business.
✅ Momentum Confirmation: The hidden indicator that changes everything.
Let’s dive in!
🚩 Real Breakout vs Fakeout: Know the Difference
A breakout occurs when price decisively moves beyond a clear support or resistance level. Imagine Bitcoin breaking above $50,000 or Gold dropping below $1,900.
A fakeout happens when price briefly breaks these key levels—but quickly reverses, leaving traders stuck on the wrong side of the market.
Why it matters: Fakeouts aren't just frustrating—they’re costly. They drain your capital and confidence. Recognizing them early keeps you profitable and disciplined.
🧠 Why Do Fakeouts Happen? (The Psychology)
Fakeouts thrive because traders chase excitement and fear missing out (FOMO). Here’s the secret many traders overlook:
Bull and Bear Traps: Institutional traders deliberately push prices slightly past key levels to trigger stop orders—only to reverse the price sharply.
FOMO-driven trades: Retail traders jump in excitedly at any small breakout, providing fuel for these short-lived moves.
Understanding these tactics can help you stay calm and avoid impulsive entries.
🔥 Volume: The Ultimate Breakout Indicator
Want to know if a breakout is real? Look at volume—it reveals the market’s true intention.
High Volume: Means broad market participation and conviction, supporting a genuine breakout.
Low Volume: A red flag! This signals low market conviction and a higher likelihood of reversal.
Example: If Ethereum breaks above $4,000 with unusually high volume, that's a strong signal. But if volume remains low, beware—it's likely a fakeout.
📐 Context and Price Structure Make a Difference
Not all breakouts are created equal. Pay attention to these key context clues:
Trend Alignment: Breakouts in the direction of a clear existing trend are more reliable.
Significance of Level: Breakouts of major support/resistance levels (weekly or monthly highs/lows) have higher odds of success.
Follow-through and Retests: Genuine breakouts often retest broken levels, turning old resistance into new support.
⚡ Momentum Confirmation: Your Secret Weapon
Momentum indicators (like RSI or MACD) tell you what's happening beneath the surface. They help confirm or reject breakout validity:
Strong Momentum: If indicators confirm the breakout direction, the breakout is more reliable.
Divergence (Warning Sign): If price makes a new high but momentum indicators show lower highs, beware—a fakeout could be near.
Use momentum as your final confirmation step. It’s the missing piece that many traders ignore.
🎯 Quick Breakout Checklist
Use this simple checklist next time you're assessing a breakout:
🚦 Trade Breakouts Wisely: Final Tips
Be Patient: Waiting for breakout confirmation saves you from costly mistakes.
Set Clear Stops: If a breakout fails, exit quickly. Small losses protect your capital.
Scale into Trades: Enter gradually to manage your risk effectively.
Mind Market Context: Always align breakouts with the broader market direction.
Trading breakouts doesn't have to be stressful. When you know what signs to watch for, you trade with confidence—not guesswork.
🚀 Conclusion: Trade Better, Not Harder
Avoiding fakeouts is all about patience, confirmation, and understanding market psychology. By using volume, context, and momentum effectively, you'll greatly improve your breakout trading.
Now, put these strategies into practice. Stop guessing—start confidently trading real breakouts today!
Happy Trading!
Like this post? Follow us for more clear, actionable trading education.
#TradingTips #Breakouts #TechnicalAnalysis #TradingEducation #Crypto #Forex #StockTrading
Ethereum (ETH): Spotted Golden Zone To Short FromEthereum has been trading in a sideways channel for quite some time, and now we see again the overtake of buyers.
We are aiming to see the price reach the upper "golden zone," which is a combination of resistance, bullish CME, and 200EMA.
Upon reaching this zone, we will be looking for any signs of rejection there and a possible MSB to form as well.
Swallow Academy

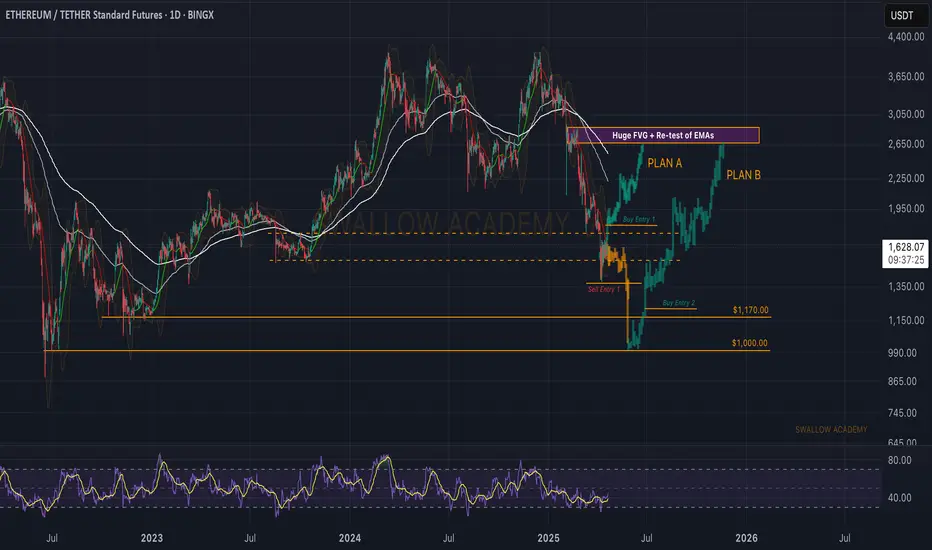
ETH Long on Daily TFAs you can see on the ETH Daily chart, the bottom is in for a long and wild rally because there are many FVGs up there to be filled, harmonic patterns have been formed and all the big liquidity downside has been grabbed. However, it can reach the targets, if the following requirements are met:
1- The volume must kick in!
2- It must first get the hold above 1950-2100 zone. Because this zone is a psychological resistance and there have been many swing lows at this zone, also it's a Weekly pivot low. Thus this zone is very important for ETH to clear.
3- BTC doesn't ruin the party!
4-Good news can accelerate the move!
Therefore the targets are as follow:
TP1: 2000
TP2: 2500
TP3: 3000
TP4: 3500
DON'T get greedy and always trade with cautious!

ETH USDT#ETH CRYPTOCAP:ETH
Ethereum is breaking the upper boundary of its descending channel on the 12H chart💁♂️
A successful breakout could trigger a massive rally with targets at $1,950, $2,120, $2,550 and $2,880🚀


ETHEREUM 2025.04.22***Follow SEOVEREIGN to receive real-time alerts on our latest analyses.
**Your boosts empower SEOVEREIGN to cover more assets and share deeper insights.
**Our team regularly publishes in-depth research reports on the cryptocurrency market.
After a prolonged period of consolidation, we’re finally seeing signs of a potential breakout. This analysis was developed using Bitcoin as a leading indicator to map the broader market structure, then applied to this specific asset to build a scenario with higher confidence. Notably, the length of wave 5 aligns precisely with the 0.618 extension of waves 1 through 3, suggesting that wave 5 may mark the completion of the current impulse sequence.
This alignment not only supports a short-term bullish outlook, but also signals the early stages of a larger trend reversal. Currently, the asset appears to be in a W-wave formation within a broader macro uptrend, hinting at the potential start of a more substantial rally.
Based on the current price structure, our targets are as follows:
First target: 1,598
Second target: 1,612
Third target: 1,632
These levels are derived through technical analysis and represent realistic milestones, assuming the prevailing trend holds. Given the wave structure and momentum behind this move, a strategy of scaling in or out based on these zones may provide a more balanced risk-reward profile.
This idea isn’t built on speculation but on consistent, repeatable wave structures and Fibonacci relationships. Rather than reacting to short-term volatility, the more effective strategy here is to understand the larger trend in motion and position accordingly.

ETHUSDT BUY/LONGBy utilizing Fibonacci retracement levels, historical patterns, , we can formulate a hypothesis that the market might follow a similar trajectory if bullish sentiment prevails.

Ethereum (ETH): Waiting For 1 of 3 Entries At Least / Buy & SellEthereum is still in-between our dotted line area, which is acting as a supportive zone there. Despite seeing some sort of buying volume building up, we are not rushing into any trade but rather showing once again multiple entry zones we are looking for before entering the trade on ETH.
As always, we need to see a proper break of line and a retest in order to consider it a valid entry.
Swallow Academy
Ethereum (ETH): Buyers Establish Support, Waiting ConfirmationBuyers seem to have established a supportive zone where buyers are showing some kind of dominance on Ethereum.
Although it is early to say that this would be the bounce zone for us, we need to see some sideways movement or a retest of that support zone, after which we are going to look once again for dominance to fall into buyers hands.
Once we see that we are going to look for MSB to form, and then we will be looking for a long position here.
Swallow Academy

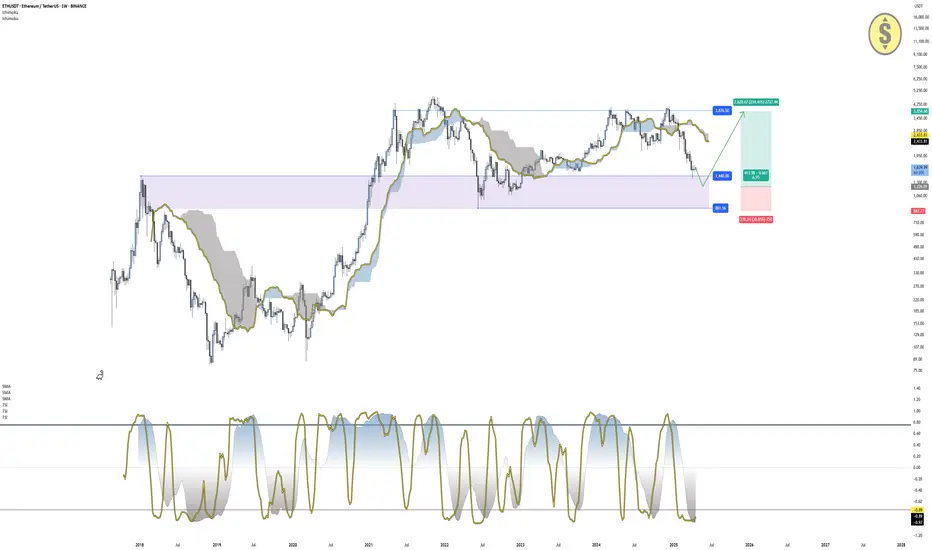
ETH/USDT Weekly – Approaching Key Accumulation ZoneEthereum is currently approaching a major support zone between $1,440 and $880, a level that acted as strong demand during previous market cycles. Price is currently below the Ichimoku cloud (Span A: $2,433 | Span B: $2,746), and the overall structure remains bearish unless price starts to break above recent swing highs.
Both Trend Strength Index (TSI) indicators are firmly in oversold territory:
TSI(10): -0.89
TSI(20): -0.97
This reflects deeply negative momentum, but historically, these levels have preceded strong reversals, especially when price enters high-timeframe support zones, like the one ETH is approaching now.
The $1,440–$880 range can be seen as a potential accumulation zone, and unless ETH breaks below $880, the bullish continuation setup remains valid. If price stabilizes here and begins reclaiming structure, especially above the $1,750–$1,950 levels, we could anticipate a move toward the $3,875 high or beyond.
Trade Setup Summary:
Accumulation Zone: $1,440 – $880
Invalidation: Break and close below $880
Bullish Trigger: Reclaim of recent swing highs
Target: $3,875 (major resistance)
Bias: Bullish while holding above $880
TSI: Deep oversold – conditions favorable for mid-term reversal
Ethereum fundamentals remain solid despite recent weakness. The upcoming upgrades to the Ethereum network (such as scalability and rollups) continue to support long-term utility, while institutional interest grows through ETH-based products and DeFi developments. Macroeconomic uncertainty, along with renewed ETF talks, could fuel a stronger recovery in the second half of the year. However, technicals must align with improving sentiment for this reversal setup to activate.
Disclaimer: This content is for educational and informational purposes only. It does not represent financial advice or a recommendation to buy or sell any financial instrument. Trading involves risk, and you should only trade with money you can afford to lose.
Ethereum 8X Leveraged Trade OpportunityIf you want to make it big really fast, there is still one last chance to get ETHUSDT with a great entry price and high lev.
The chart setup is good. The market is good and everything is great.
Market conditions are only improving and the Altcoins are starting to heat up.
Right now, you see $1,600 but tomorrow the price can be $1,800 or more, that's how the Altcoins work. One day everything is quiet, the next day everything blows up. By the time the action is in, it is too late to buy, but not now, there is still one final chance to get bottom prices before the 2025 bull market shows up in full force.
Here is Ethereum, ETHUSDT, a great chart setup. Once the breakout happens, it will never trade at this price ever again. This is the last chance. It is yours to take.
Thanks a lot for your continued support.
I am wishing you profits, health, wealth and success.
You are appreciated, always, and you deserve the best.
Namaste.

ETH Faces Strong Resistance—Bearish Trend Likely to Continue ETH Faces Strong Resistance—Bearish Trend Likely to Continue
ETH has struggled twice to break above the 1685 resistance level, keeping the price in a downward trend.
So far, the bearish momentum remains strong.
While there could be a slight recovery near 1615 due to low trading activity, a big price increase seems unlikely.
Another bearish wave may follow, with potential downside targets at 1500 and 1410, as shown in the chart.
You may find more details in the chart!
Thank you and Good Luck!
❤️PS: Please support with a like or comment if you find this analysis useful for your trading day❤️

ETHUSDT | One of Today’s Top Volume GainersEthereum has been attracting a lot of attention today, with trading activity picking up noticeably. If you’ve been watching closely, you’ll see that the blue boxes above price are acting as reliable resistance zones. Every test of these areas has been met with selling pressure, suggesting bears remain cautious here.
Key Observations
• Blue Boxes as Resistance
These zones have halted rallies before. Expect price to struggle when it reaches these levels unless strong bullish energy steps in.
• Potential Bullish Shift
Markets can turn quickly. If Ethereum breaks above a blue box with solid volume and then retests it successfully, I will drop my short bias and look for a long entry. Until I see that confirmation, I remain skeptical of further upside.
How to Trade This Setup
Short Entries on Rejection
Wait for price to approach a blue box and show clear signs of weakness on a 5‑ or 15‑minute chart. Once you see a confirmed break down in structure and CDV supports selling pressure, that’s your signal to short.
Switching to Long
If a breakout occurs above the blue box with conviction and price comes back to retest it successfully, shift your bias. Only after a retest holds and lower‑time‑frame confirmations appear will I consider going long.
Patient Execution
Trading isn’t about jumping at every move. We wait to see what the market tells us. When you trade based on confirmation rather than assumption, you avoid the traps that catch so many.
Why Trust This Analysis
I focus on setups that combine volume, structure, and real‑time order flow signals. My track record—verifiable right on my profile—shows a high success rate because I trade with discipline and clear rules. If you want clarity instead of noise, stay tuned and act on confirmed signals.
📌I keep my charts clean and simple because I believe clarity leads to better decisions.
📌My approach is built on years of experience and a solid track record. I don’t claim to know it all but I’m confident in my ability to spot high-probability setups.
📌If you would like to learn how to use the heatmap, cumulative volume delta and volume footprint techniques that I use below to determine very accurate demand regions, you can send me a private message. I help anyone who wants it completely free of charge.
🔑I have a long list of my proven technique below:
🎯 ZENUSDT.P: Patience & Profitability | %230 Reaction from the Sniper Entry
🐶 DOGEUSDT.P: Next Move
🎨 RENDERUSDT.P: Opportunity of the Month
💎 ETHUSDT.P: Where to Retrace
🟢 BNBUSDT.P: Potential Surge
📊 BTC Dominance: Reaction Zone
🌊 WAVESUSDT.P: Demand Zone Potential
🟣 UNIUSDT.P: Long-Term Trade
🔵 XRPUSDT.P: Entry Zones
🔗 LINKUSDT.P: Follow The River
📈 BTCUSDT.P: Two Key Demand Zones
🟩 POLUSDT: Bullish Momentum
🌟 PENDLEUSDT.P: Where Opportunity Meets Precision
🔥 BTCUSDT.P: Liquidation of Highly Leveraged Longs
🌊 SOLUSDT.P: SOL's Dip - Your Opportunity
🐸 1000PEPEUSDT.P: Prime Bounce Zone Unlocked
🚀 ETHUSDT.P: Set to Explode - Don't Miss This Game Changer
🤖 IQUSDT: Smart Plan
⚡️ PONDUSDT: A Trade Not Taken Is Better Than a Losing One
💼 STMXUSDT: 2 Buying Areas
🐢 TURBOUSDT: Buy Zones and Buyer Presence
🌍 ICPUSDT.P: Massive Upside Potential | Check the Trade Update For Seeing Results
🟠 IDEXUSDT: Spot Buy Area | %26 Profit if You Trade with MSB
📌 USUALUSDT: Buyers Are Active + %70 Profit in Total
🌟 FORTHUSDT: Sniper Entry +%26 Reaction
🐳 QKCUSDT: Sniper Entry +%57 Reaction
📊 BTC.D: Retest of Key Area Highly Likely
📊 XNOUSDT %80 Reaction with a Simple Blue Box!
📊 BELUSDT Amazing %120 Reaction!
I stopped adding to the list because it's kinda tiring to add 5-10 charts in every move but you can check my profile and see that it goes on..
ETH -bullish indicationsbearish indications:
LLLH in daily
MA 21 being respected in daily time frame.
Bullish indications:
Trend line resistance is broken and acting as a support now.
Inverted hammer candle from trend line support in 1 hr
formed Inverted head and shoulder formed in 15 min .
Bullish divergence in 15 min.
Trade plan bias long @ 1579
SL:1570
TP1:1589
TP2:1597

ETH short CRYPTOCAP:ETH 2H SHORT.
The asset retains the potential to decline within the current structure.
The most favorable conditions for opening short positions can be formed after the test of POI 2. Also, the scenario of entry within the local zone of interest POI 1 (15m) remains relevant.
Target benchmarks: $1537, $1521, $1503, $1470.

ETH SHORTCRYPTOCAP:ETH 2H SHORT
The asset retains the potential to decline within the current structure.
The most favorable conditions for opening short positions can be formed after the test of POI 2. Also, the scenario of entry within the local zone of interest POI 1 (15m) remains relevant.
Target benchmarks: $1537, $1521, $1503, $1470.

EHT - Excellent Signal/TA 4 Days Ago. Several Trades.1️⃣ That 4H Level was Sniping 🎯 👌 😎
2️⃣ We were aiming blue TL or 4H Level for Short.
3️⃣ Some Bearish Divergences in Volume confirmed our Short at those Peaks at 4h Level..
4️⃣ 3x nice Shorts: 4.8% 2.6% 2 % 🎯👌💰💵💲
Additionally, here a local TA in lower TF. Small Bullish Momentum.
Original TA/Signal:https://www.tradingview.com/chart/ETHUSDT.P/QkCStdl9-ETH-Some-New-Local-Levels/
Follow for more ideas/Signals.💲
Just donate some of your profit to Animal rights or other charity :)✌️

Long trade
🚀 Buyside Trade Breakdown – ETH/USD
📅 Date: Saturday, April 19, 2025
⏰ Time: 4:30 PM (NY Session AM — late NY session weekend)
🪙 Pair: ETH/USD
📈 Direction: Buy (Long)
Trade Parameters:
Entry: 1613.56
Take Profit (TP): 1631.01 (+1.08%)
Stop Loss (SL): 1612.93 (–0.04%)
Risk-Reward Ratio (RR): 27.7
A 2min or sub-minute TF setup,
Executed at the retest of a refined LTF demand zone. The tight stop loss of 0.04% reflects high-conviction execution, as sell-side liquidity was flipped to the buy-side, confirming directional bias.

It's time for the decision. There are two scenarios around here! First, ETH is creating semi diamond pattern which is reversal and may trigger a bounce to ~$1.76k. Second, It is struggling with the downtrend line and SMA which are serious resistance that may cause a fall to ~$1.4K again. So keep watch on ~1.6K and see how ETH decide to move.

Eth local targetsSo if we get above 1672 there is a high possibility to go to our first target at 2305.

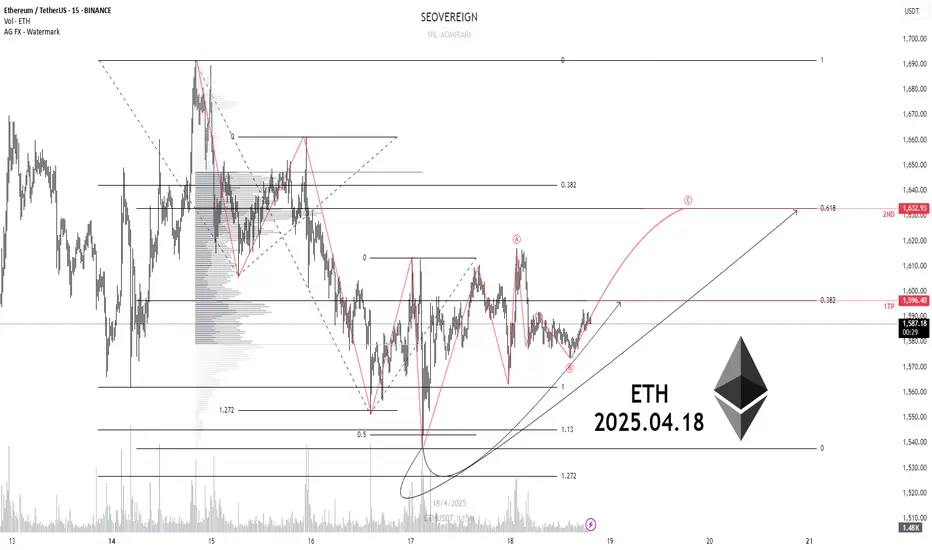
[ETH] 2025.04.18***Follow SEOVEREIGN to receive real-time alerts.
**Boosts help SEOVEREIGN continue analyzing more assets.
**Our team regularly publishes in-depth reports on the cryptocurrency market.
ETHEREUM has been showing a steady rebound since forming a bottom near the 1,528 level.
The current chart structure clearly reflects a wave development based on the Elliott Wave Principle, which can be interpreted as a signal for a potential medium-term bullish reversal.
The detailed wave count has been provided in the idea for reference.
Projected target levels are as follows:
First target: 1,596
Second target: 1,632
Given the current positioning, a brief consolidation phase may occur, followed by a stronger technical rebound that could lead to a sequential achievement of the above targets.
The alignment between the wave structure and market compression supports the validity of the ongoing upward scenario from a technical standpoint.